Kipchoge is famed for his excellent running form and economical stride and in Oct. 2019 he became the first man to run a marathon in under two hours. I found footage of the run on Youtube and watched a section from the last kilometre to calculate his stride length.
How to calculate stride length manually
You can skip past this section if you’d rather not get into the details
As we know Speed = Stride Length x Stride Frequency. We can rearrange that as Stride Length = Speed divided by Frequency. And because Speed is actually the distance covered in a time period (e.g. miles per hour); we can convert it to a Pace (e.g. 15mph is 4min/mile because 60mins / 15 = 4).
We need to find out how fast he’s running and how many steps he’s taking in a set period to be able to calculate the stride length.
Step 1 – Watching the footage I found a section where the camera showed Kipchoge for a decent length of time; the longer the better as it gives a more accurate sample. The particular segment lasted twenty seconds.
Step 2 – I counted the number of times his left arm swings. It doesn’t matter whether you count armswings or footsteps they’re going to match. Generally though I find armswings are easier to count. I counted thirty armswings.
Step 3 – As this was a twenty second clip, I had to triple it to get the cadence for a minute (3×30 = 90). But this was only for the swing of one arm so I doubled it (90 x 2 = 180) to get the total for both arms. Given arms and legs swing at the same rate, it gives the number of steps per minute – 180. Very conveniently it’s also three steps per second.
Step 4 – The marathon was run in 1:59:40 – an average pace of 4:34/mile. I remember Kipchoge was very consistent in his pacing so I’ve got a high level of confidence that his is how quick he was covering the ground.
Now I calculate how many steps Eliud covers in his 4:34 mile. In four minutes he covers 720 steps (180×4) and then in the remaining thirty-four seconds takes another 102 (34×3) for a grand total of 822 steps per mile.
Step 5 – As a mile is 1,609 metres and we know Kipchoge takes 822 steps to cover it, it works out that his stride length is 1.96metres (1609 / 822).
NB This final step has an implicit conversion from Imperial to Metric measuring systems. I could have gone metric earlier as I know he was running at 2:50/km, so he was taking 510 steps per km (1000/510 = 1.96) to get the same stride length.
Kipchoge’s Stride Length
If you skipped straight down here, let’s recap …. at his marathon pace of 4:34/mile, Eliud Kipchoge is taking 180 steps per minute with a stride length of 1.96 metres. What’s interesting, and defeats those people who say they have little legs, is that Kipchoge is only 1.67m tall (5’6”) – his stride is over 15% longer than he is tall.
I also found video of 18-year-old Eliud Kipchoge winning the 5000m gold at the 2003 World Championships in Paris. His running form looks a little less smooth than these days but he was still able to win in 12min52. I counted steps for one of his 400m laps close to the end of the race – he completed it in a touch under 1min05 – a pace of 4:21/mile. He took 202 steps and that works out to a stride length of 1.83 metres. Surprisingly it was shorter than he ran for a whole sub-2 marathon but may begin to explain why his form looked less smooth.
Nonetheless whichever race you look at Kipchoge’s stride length is bigger than he is tall and that’s worth thinking about.
If you found these posts about Stride Length interesting, you might want to take a look at the series I’ve written on Cadence or Stride Frequency as it’s also known. Click here to access the introduction.
No wonder I’ve been on the decline for the past month. I went for my long run at 6:25am this morning, in the dark, determined to keep it easy. Remember easy is a feeling, not a pace. It took me thirteen minutes longer than last week to do the same ten mile run. My heart-rate barely got out of the 120s yet my body didn’t want to run any faster. I’m sure I could have run faster but that wasn’t the aim, I was listening to my body and letting it decide. Truth is, I’ve spent most of the past month training faster than this and it explains why I’ve slowly been spiralling towards decrepitude.
I can’t call this overtraining because that’s a serious condition that can take months to recover from. Usually the term for having pushed the body past its best while not having become overtrained is known as overreaching. Overreaching is something most athletes actually want to do just prior to competition because it gives them a higher level of performance yet because they taper they get to freshen up. Generally speaking overreaching can be recovered from quickly whereas overtaining takes months.
Whatever I should call it, my training and running isn’t going forwards like it was a few weeks ago. I sensed the signs of a couple of weeks ago, but I wanted to finish out JackD’s 800m training plan so I could say I followed it to the letter.
These are the signs I spotted
Loss of motivation
A couple of weeks ago I found myself no longer caring about the next 800m time trial. After almost four months training I should have been excited that it was only a couple of weeks away but I wasn’t. My mind didn’t care and I was actually looking past it to the next phase of training I’ve got planned.
For someone as dedicated as I am, the loss of motivation was a huge red flag that my body wanted to back off. I’ve had it before and it’s always the same – simply wishing that I could get past the remainder of training, start tapering (which is of course reduced training) and get to the race. Often I never made it to the race as an injury or illness would kick in – those were probably the result of doing too much.
As an aside, I believe many first time marathoners experience this sort of thing. They start off their training excited and motivated, then as the long runs pile up and they trudge through four hour Sunday runs, they start to wish it all over.
High resting heart-rate
Before I start a run I have to wait for my GPS watch to lock in the satellites. This usually takes at least a minute of standing around on my driveway or by the car before I can start running. When I’m fit and healthy my heart-rate will drop to somewhere around 40bpm, quite possibly in the high 30s. When I’ve trained harder the day before it may be mid-40s. When I’ve trained very hard the day before it’ll be in the 50s. It might even do this for a day or two extra. Over the past two weeks I’ve barely seen my heart-rate barely dip into the 40s, moreover it’s been low 50s. That’s a red flag.
Sometimes, while HR will still drop down it takes a while to occur. It seems to be stuck in the 50s for thirty seconds before dropping rapidly to the low 40s. That’s an amber flag that things may be becoming problematic.
I don’t think there’s an issue per se with the occasional high resting heart-rate but, as I say, I’ve been seeing these without fail for the past couple of weeks.
Tightness, aches and pains
I previously wrote about how tightness, aches and pains are a sign of overdoing things in this post. They’re probably the earliest physical sign that crops up but also isn’t actually debilitating unless you continue to push hard. Usually though when any aches or pains ease off during running as joints and muscles get warm and loosen up. It’s later in the day or first thing in the morning when they’re a problem. I’ve been struggling with stiff ankles and hip pains regularly recently.
Other signs
These first three things are the most reliable, obvious indicators that things aren’t right. Any one of these three would usually be enough for me to begin reconsidering my training plan and slot in recovery sessions until the issue is gone.
What follows are less noticeable or isolated. The following signs usually need to be seen as one part of the jigsaw. Individually I don’t think they’re enough because they’re also somewhat vague and harder to measure accurately. Diagnosing yourself as overcooked is no easy thing to spot with certainty.
Affected sleep
If you overtrain and rev up your central nervous system it can affect your sleep patterns. These past couple of weeks I’ve found myself waking multiple times during the night and dropping straight back to sleep. But on a couple of occasions, I found myself sleeping solidly for nine hours on back-to-back nights.
When I seriously overreached a few years ago, I found I’d wake in the night to use the toilet. Then struggle to drop back to sleep and just lie there for 2+ hours thinking of absolutely nothing. No stress or anxious thinking, simply unable to drop off to sleep. This is another way the over-revved CNS can affect sleep.
Affected appetite
When I’m training too hard I find I tend to start wanting more sugary foods – crisps, cakes, beer. Basically my body is craving anything that will give me more calories and quickly. This isn’t always an issue as for many years I used to eat a lot more calories in response to playing sports hard. Similarly, I have found myself drinking more cups of tea or fluid in general.
While I haven’t experienced it, I’m sure overdoing things could also result in loss of appetite.
Failing to hit target times in workouts
Missing workout targets happens from time to time so you need to see it becoming a pattern. Throughout the earlier periods of my 800 training there were days where I struggled to hit targets but would come back refreshed a few days later and be on time. One session isn’t a problem, two should be noted, three in a row becomes a concern.
General runs are slightly slower
Looking back my Sunday long runs peaked a month ago and I’ve struggled to run them as quick since. Likewise when parkrun returned in July, I was running them at the limits of comfort in 23-24 minutes; this has slipped closer to 25-minutes. It’s been a small difference that I’d attributed to my legs being tired from the fastest speedwork being done in this phase of training.
But sometimes heavy legs or slower general runs can be a symptom of the initial response to an increase in training.
Loss of strength
I do strength training once per week. Two Wednesdays ago I found myself barely able to flex my biceps and lift the weight. The struggle was there again this week. I wasn’t sure if it was the “introducing new stuff” drop off that I mention above so I gave it another week.
Steve Magness lists examples of CNS fatigue as including reduced grip strength, worse ground reaction times during depth jumps or hops, and slower reaction times.
Summary
I’ve listed some of the key things I’ve noticed in the past two weeks that were suggesting I’d overcooked it. As I said, the main reason I didn’t back off was because I wanted to see JackD’s plan through to completion but it was also because I was so close to finishing that I was trying to hang on – that becomes a dilemma.
Many elite runners say they notice their moods before any physical signs show up. Apart from aches and pains, I’d certainly say my change in motivation was the most noticeable harbinger for me this time around.
And in case you’re wondering, the solution if you do decide you’re overcooked is to back off your training. Ensure easy runs are easy – as I did this morning. Cut some or all of the intensity out and give the body less training to recover from. It often only needs a few days to two weeks get back on track, and I don’t think it’s been more than three weeks at the most.
Like all runners I want to get faster. How you do this is, of course, the difficult part. Having a coach or following a plan takes you through the workouts you need to do to improve speed, stamina and endurance appropriately to your event.
There are certain guidelines for what you’re trying to do; for example, 100m sprinters are working on top-end speed and trying to be as efficient with their running form as possible. Marathon runners are training to improve their aerobic efficiency and top-end speed isn’t too important to them. Everybody in between is working on some variation between these.
Paula Radcliffe still getting air time at mile 25 of 2002 Chicago marathon
But even when you think the marathon is more about endurance than speed, you discover world class marathoners are fast. Take Paula Radcliffe, she can run 4min25 for a single mile where most parkrunners can’t even run 200 metres at this pace.
The Formula
The simple mechanical explanation of speed is that it’s the amalgamation of how quickly you move your legs and how far you travel with each step. More commonly this is quoted as a formula of Speed = Stride Length x Stride Frequency. I first learned about this in the mid-1990s but never really thought about what to do with it.
On the stride frequency (cadence) side there’s a lot of talk about how the magic number of steps to take is 180 per minute. I’m not going to dig into that here today as it’s much discussed around the internet, only to say there is no magic number to achieve. It’s the Stride Length side I’m currently interested in. [Note: I have now written a series of articles on Cadence which begin here and provide some interesting data – clicking on the link will cause it to open in a new browser tab].
What is Stride Length?
Around the time I learned the formula, I started to hear about how the great 400m hurdler Ed Moses had a stride length of 2.70 metres which enabled him to take thirteen steps between each hurdle.
When I looked up what a stride was, it was defined as two steps e.g. right foot then left foot or vice versa. So by that definition your stride length would be how far you cover from when your left foot hits the ground to when it hits the ground again. That would suggest each single step by Moses was only covering 1.35 metres yet when I did the calculations that didn’t seem right.
It turns out when runners, coaches or commentators talk about stride length they’re using the term interchangeably with step length. For runners, stride length is the distance you cover with one step. If you stand with both feet together and step onto the right foot, it is the distance you’ve covered in this step.
If you’re going to try measuring it, remember to measure consistently from the heel-to-heel or toe-to-toe. Often though you can find out from the stats produced by GPS watches – if they’re capable of measuring cadence.
Garmin stats from a run – avg stride length highlighted
Elite stride length
400m hurdlers
I said that Ed Moses is famous for his 2.70 metre stride but it’s not just him. When I was watching the Tokyo Olympics over the summer, I switched onto the final of the women’s 400m hurdles. The commentators were discussing how Sydney McLaughlin – the world record holder – runs 14 steps between the hurdles until the final one when she increases to 15 steps because of fatigue shortening her stride. I found out the distance between the hurdles is thirty-five meters making her long stride to be 2.50 metres and dropping down to 2.35 metres when she tires. That’s big and it’s stunning.
Measure out 2.50 metres and you’ll realise why I still harboured some doubt about whether I was understanding what stride length is. Were elite runners really covering the length of a small car in one step? Or was their stride the technical ‘two step’ definition? I went looking for direct evidence.
David Rudisha – 800m
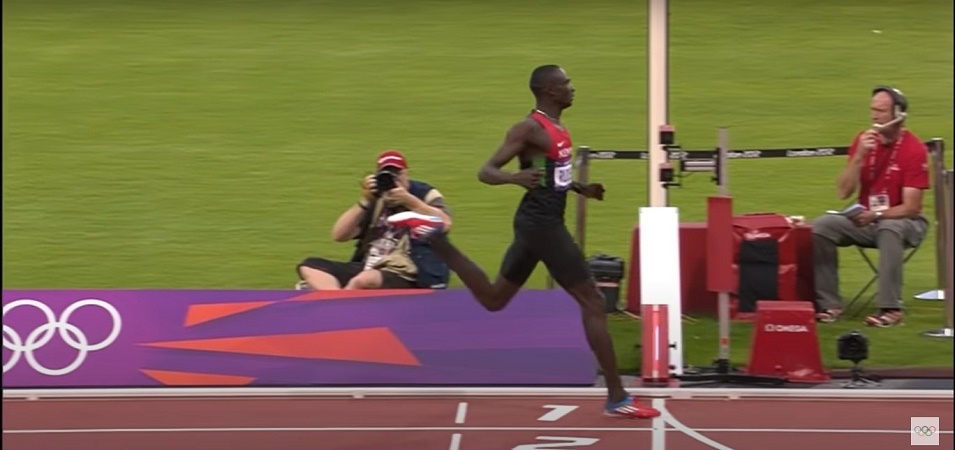
I found some decent Youtube footage of David Rudisha running the 800m at the London Olympics. It’s the race where he set a new world record. As he crossed the line he was well ahead of the rest of the field and there was a good angle on it.
And below he is one step before! It seems unimaginable how he will go from toeing off at the red triangle next to the Olympic logo and ending up on the finish line but he does.
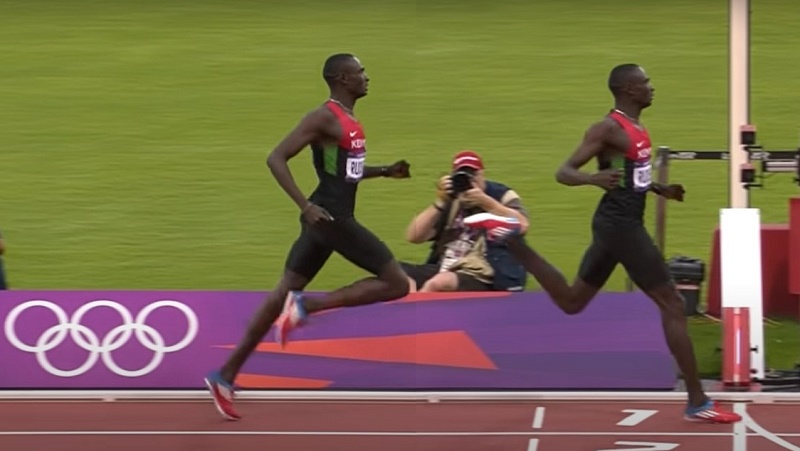
Here’s a combined picture to make things simpler. We can see it’s quite some distance.
Rudisha is recorded as being 1.88m tall so let’s put some lines on the photo and estimate how long his stride is.
He’s not standing fully upright so the yellow line is around 1.75m. The red line is just above his knee and, fortunately as I’m the same height, I can estimate it to be around 70cm. That’s a total of 2.45m.
The exact measurement doesn’t really matter, what’s important is we now have visual proof that a world class runner takes well over two metres with a single step.
Finally here’s a look at his last two steps, he’s easily covering the better part of five metres. His black shorts make it harder to identify which leg is forward or backwards but if you look at his shoulders there’s no doubt about it. And you can also see how far his body moves over the top of his support leg as he pivots from landing up to toe-off.
Women’s 10K
So far I’ve talked about the stride length of the 400m hurdler and 800m runners. These shorter distance track athletes always have a longer stride than distance runners because the speeds they run (around 3 – 3min30/mile) are that much quicker.
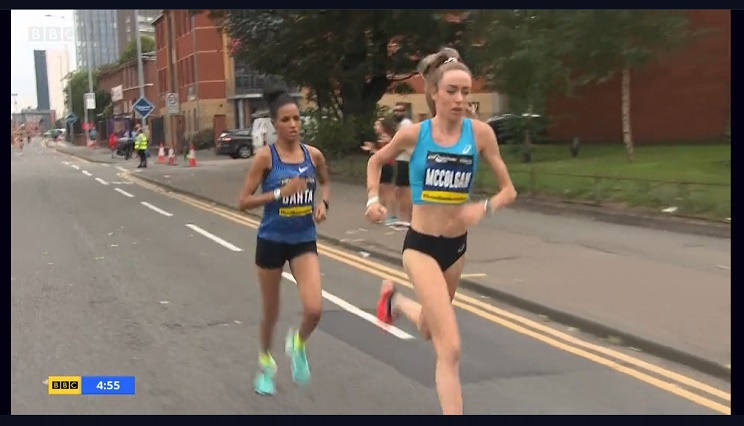
Last weekend the BBC were showing the Great Manchester Runs. A friend who was watching the women’s 10K race messaged to point out the difference in running styles of the two lead ladies – Eilish McColgan and Meraf Bahta.
It was clear McColgan has a long, bouncy stride with a high back kick – probably because she’s still doing shorter track races – whereas Bahta’s stride was shorter and flatter. By flatter I mean she’s staying more level with the ground, less bounce.
Rewatching footage from the second kilometre I counted their respective cadences. McColgan was running at 172 steps per minute, Bahta up at 200. It’s a notable difference and knowing that they were running together slightly faster than 3min/km (4:45/mile) you get an indication of their stride lengths – McColgan’s is 1.97m and Bahta’s 1.70m.
Ordinary runners
McColgan is impressive but it’s Bahta who really makes the point. Even for a high cadence runner, she still has a stride length far above that of most runners. Most of the ordinary runners I know have short stride lengths according to their Garmins. If it’s much over a metre on a general run that’s unusual. Of course you can’t big stride all the time but I doubt many have the strength and technique to extend their stride out when required.
My 10K races have an upper end value of something like 1.4m when I’m fresh and usually drop into the 1.30s by the end. I’m sure I’m not unusual in this respect and of course I’m not running world class pace so it’s naturally going to be shorter at my slower race paces.
Most ordinary runners work on their cadence with no thought for improving their mechanics or top-end speed to create a longer stride length. This is a mistake because as we’re seeing with someone like Bahta, that longer stride length is still beneficial when you have a high cadence.
The way you develop a decent stride length is by pushing off more powerfully. You don’t reach out in front of you, you launch yourself forwards through the air with each step. Think of it like being on a pogo stick using the spring to load up and travel forwards for as much distance as possible. As a runner when your leg is behind you, you extend your hip, your knee, your ankle to push forwards. Learning this technique is best done during strides or hill sprints. Short efforts where you’re not concerned about running out of energy or fatiguing.
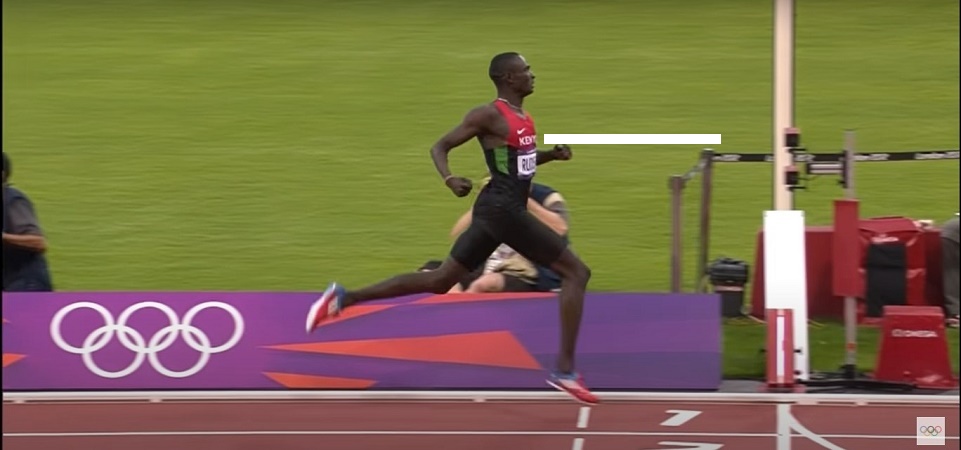
One last picture of David Rudisha to marvel at. It’s during the flight phase of the last step. His foot is a good half metre or more before the line and looks like he will land there yet somehow he travels on., His effort at toe-off propels him forwards the extra distance before his foot hits the ground. It happens quickly and horizontally. There is very little drop which is what the white line is there to help see.
The white line is lined up with the word “Kenya” on his vest and level just above the black tape by the finish. Take another look below at the finish line photo and you can see he’s only dropped a matter of inches to now be level with it.
When he was in the air, he wasn’t actually high off the ground. His effort goes towards pushing him forwards not up into the air. If you watch slow runners they use a lot of energy bouncing up and down rather than going forwards – this is bad.
If you want to marvel at Rudisha’s running, here’s the video of his 2012 Olympic run. There’s a good, slow motion close-up at the 7min10 mark.
I wrote another article looking at Eliud’s Kipchoge’s stride length and detailing how I calculated it here.
The second cycle of 800m training is coming to a close. Next week I’ll go do an 800 time trial and see how successful it’s been. The last block of training through July-August was mixed in its success. I felt stronger by the end of it but quite often missed the target times due to overly tired legs. Missing target was a little demoralising yet seeing other things going well helped offset that.
This month’s training has been about sharpening up for the 800TT. Its focus has been miles at Threshold pace to help build Lactate Clearance, along with short intervals at 800m and mile pace for building Lactate Tolerance. The hardest efforts, which need some psyching up for, are the long 600m efforts at 800m pace. On their own it wouldn’t be awful but often they’re thrown in as one part of a bigger session. For example, the first week was simply three 600m efforts with a 1km jog recovery – each effort takes a full-on effort.
Threshold running (T-pace)
The early efforts for these came in around 6:50-55/mile pace. This was a good twenty seconds faster than the same workouts six months ago. But as my fitness sharpened up I began to run them faster and by the past week I was running at 6:40.
The dilemma has been whether to stick to pace or trying to go based on how the body is reacting. As I’m not one for staring at the GPS anymore I’ve opted for the latter hence why my fastest effort came in at 6:34! Considering during July-August I was struggling to run my kilometre intervals at this pace, it all suggests training has been going in the right direction.
Mile-pace running (R-pace)
The plan has been packed with 200s at mile pace but, they’re often at the end of a Threshold session when the legs are tired and heavy with lactate. Sometimes they’ve been hard to get on-target, needing lots of effort to scrape in; other times it’s seemed easy to hit target with lots to spare.
Given the aim was to hit 44sec there’s only been one over 44½sec which was into a headwind; I judge them as having been a success.
800m-pace running (FR-pace)
These have been the rewarding part of training. Last time I was aiming to complete 600s in 2:06 and I only managed it once. This time, I was aiming for 2:00 and managed to get under it three times along with two more at sub-2:02 – not too far off.
There have also been some slower 600s and last Thursday finished on a low note with them coming in at 2:07 and 2:09. I can throw out excuses about high winds but, in the end, I still like to hit target. Yet when I think back to the start of the year I was running my initial 600s in around 2:23 there is something good happening overall.
There were a couple of 400s mid-month which came in on target at 1:18-19 compared to 1:27-29 in the equivalent session six months ago. And again at the beginning of training I remember one misjudged effort came in at 1:41!
The shorter intervals of 200, 300 have been interesting. Generally I’ve struggled to run them much faster than last time around. Fastest 200 in March was 37.45s, this time it’s 36.73sec; so there is a little more quickness but it’s not been a massive leap. I got a couple of sub-37s on a wind-assisted day and sub-59 300s on another.
So it really seems like I’ve improved my speed endurance this go-around but haven’t done much for my actual top end speed. The 200s are averaging sub-5 pace now which is pleasing given I couldn’t even hit that pace at the start of the year. Doing strides has been a factor on the speed side and I managed to get the pace down to 4:07/mile momentarily on one so hopefully there is more to come.
Stats
I’m not going to go overboard on the stats as they’ve been so variable. But to give an indication of my fastest efforts in time and pace; plus what that multiplies up to over 800m. It’s noticeable that the longer efforts of 400-600 are about the same pace.
Fastest
Pace
800m pro-rata
200m
36.73s
(4:55/mile)
2:26.9
300m
58.23s
(5:12/mile)
2:35.3
400m
1:18.9
(5:17/mile)
2:37.7
600m
1:58.22
(5:17/mile)
2:37.6
Running form
Since starting the second time around with the plan, I’ve been working on my running form. I’ve specifically been trying to figure out how to sprint faster and somewhere over the past month or so it all began to come together. I found my legs were beginning to spring off the pavement and each stride would cover more distance. This has caused muscles in my right hip and glutes to get more active to fire produce thee springing action but also involved protecting muscles around the calves and quads that absorb the landing forces. These actions are beginning to become second nature now and with the initial stimulus over, I expect them to build in coming weeks.
Summary
The most pleasing part of training is that my fitness has remained throughout. There have been one or two sessions where I couldn’t get it done but that’s to be expected. There are always ups and downs.
When I did this same training block six months ago, I struggled to get any of the 600s on target and they even slipped backwards by the last couple of weeks. I think this is part of why my time trial barely improved last time around (2:58-55). This time I’ve been hanging in there and am now hoping my 800TT will see a significant improvement – at least scraping down into the 2:30s.
My easy runs have begun to get quicker over the last week or so and I’m beginning to feel like I’m getting back to the form I had back in 2012. Not quite there yet but I am intending to do a fast parkrun in October as well. So that’s all to look forward to in the next update!
A recent Thursday workout was a combination of fast intervals – 600, 400s, 200s. The first came in at 2min05. The 400s both pleasingly scraped under 1min20 while the 200s were a final gasping all-out effort to get on target. Arriving home the 400s and 600 were what stuck out in my mind because they were close to the times I used to clock when running round Poole Park cricket pitch. In fact, when I looked them up I discovered the workouts I did were exactly a decade ago. How times move on.
In September 2011, I wasn’t the committed runner I am now. My first six months of the year had only seen me bank less than two hundred miles but I could run a 21:30 parkrun. In July I started doing a proper warm-up which knocked over thirty seconds off taking me sub-21. I then entered New Forest half marathon for late September and this triggered my “train harder” instinct.
My belief about getting faster at running then was based around the same idea as most people – run faster in training. But, as a sports and exercise science graduate, I’d also read up on the ideas of increasing VO2max through hard interval training and Lactate Threshold through tempo runs and through Stephen Seiler’s MAPP website thought this was the way to train. It was unsophisticated stuff but to the untrained runner it has initial benefits.
I decided hard intervals, aiming for a 19-min parkrun pace, were the way forward. After all, if I wanted to run nineteen minutes I needed to train at the pace. It didn’t seem insurmountable as I’d run a 5:55 mile in the summer which is a similar pace.
I didn’t own a GPS watch but had a sportswatch to time my runs and used a heart-rate monitor. The watch could store some basic info with the lap button but I’d often simply commit numbers to memory and write them down when I got back to the office! I have many spreadsheets filled with this sort of data.
I found a website (Gmap-pedometer) which allowed me to measure distances and found a lap of the cricket pitch to be a third of a mile. Starting from a particular blue bin and running to the pavilion is 400m. I still use these measurements to this day.What I did next is some maths. I calculated with the cricket being about 530m, I’d need to run nine or ten laps to cover the 5,000m distance of a parkrun. Nine laps would fall short at 4,770m; ten would come in at 5,300m and ensure I had a little extra in the tank. With a 19-min parkrun being about six minutes per mile, each of these lap would need to be covered in two minutes, 400m in 1min30. I’d give myself one minute’s recovery between laps and push hard on the efforts. After all, if I could run them faster it must be better and lead to improvement?
This was my plan for improving and it had worked for me on the rowing machine many years before. But there were two immediate flaws with what I did.
With my then-parkrun pace at around 6:40/mile, I was asking a lot to jump down to running 6min/mile with nothing to bridge the gap. Certainly I was capable of the pace but to do ten intervals with only sixty seconds’ recovery was asking too much of myself. When I succeeded on the rower I’d been aiming a few seconds faster than my existing times. It’s why when I became a successful parkrunner six months later, and got my time down to nineteen minutes, it was because I only ran intervals at a few seconds faster than my existing parkrun pace.
I tried to cover the distance rather than do enough work to stimulate improvement. These days I’d wouldn’t do more than 3,200m worth of work at mile pace and around 1,600 – 2,400m is more usual. A full 5,000m is simply too much stress on the body to recover from. Think about it, when you train for a marathon, you only do a long run of 20-22 miles maximum. If you’re doing 10K training then the elites will only do 6-8K at race pace. It’s a mistake to believe just because the race distance is relatively short, you need to cover it in training.
The biggest flaw though is that, when I began doing these intervals ten years ago, I didn’t lack speed. As I wrote in filling in the gaps, you have to figure out what’s missing. My issue was endurance and lack of aerobic capacity. My parkruns improved three months later after I’d logged many easy miles with just the occasional fast parkrun thrown in. I already had the top end speed, it was the endurance base that was missing.
Pandemic over, a friend posted he’d taken part in his “first non-endurance race” in two years. I was stunned. This is someone who coaches and, as one of the faster runners, has others looking up to him.
My shock was because his race was a five miler and he’d taken over thirty minutes. That’s an event of endurance. Somewhere around 95% of the energy comes from aerobic sources. If you’re of a metric disposition, it’s a touch over 8K; lying somewhere between the 5K parkrun and 10K races.
I’m sure he referred to it as an event of non-endurance because it’s not a half-marathon or marathon which require a higher volume of training miles. I guess it’s partly because he’s regularly capable of running five or six miles in a training session that he thinks there’s no endurance involved.
But it reveals a huge misconception that many runners make because they don’t understand how important endurance is in distance racing. And by publicising his five mile race as non-endurance, he wasn’t pointing anyone to the correct ways to train.
Parkrun is an event of endurance but many think the fast pace of front runners is created by speed training. And to an extent it is. You have to be capable of running at five minutes per mile pace if you’re going to run a parkrun in sixteen minutes. You need some speed training to cover ground quickly.
But speed can only be sustained for 1-2 minutes before you begin to huff and puff. Running a bit slower than top end speed will allow you to last longer but it doesn’t actually build the body’s endurance mechanisms. I’m not going to go into the best ways to build endurance, but I guarantee running fast, gasping for breath and hoping to hang onto it is not the way to do it.
Deliberately building endurance is the key reason why so many people who’ve spent six months training for a marathon are stunned when they return to parkrun and run a PB. They can’t figure out how they can be faster through only doing slower miles.
But, for as long as people think of parkrun or the 10K as “non-endurance” it’s going to be impossible to reach their potential. By process of elimination, if they think of these distances as “non-endurance” then they will train for speed to get faster at them. It simply doesn’t work.
The closest events get to being “non-endurance” are the sprints (100m – 400m) which are trained for by concentrating on speed. Even then their coaches talk about speed endurance. Any event beyond the sprints, starting from the 800m, has a large aerobic component that is improved by working on endurance.
If you missed part 1 you can find ithere, part 2 is here, part 3 is here, part 4 is here.
There’s no doubt that some decline occurs as we age but, in the past, it was thought to be purely a genetic thing. To still be racing well beyond fifty, if not forty, was something only those who were blessed and lucky could do. This myth has lasted well into the 21st century and is only beginning to be broken down in recent years. Often it’s used as an excuse or rationalisation by runners who either don’t know how to train, can’t be bothered to train or simply fear not being up the front.
The reality is decline, as experienced in the past, was more often a circumstantial thing. The people who went running usually competed for clubs. They started when they were young, had a high level of commitment and/or natural talent and continued on for some years. As their lives took on family responsibilities, they often found themselves racing slower and beginning to turn to the longer distance events.
Even twenty years ago training knowledge was less sophisticated. Plans, advice and methods were simpler than today’s but also often consisted of runners exhorting each other to “run hard” and “train hard” if they wanted to be fast. That’s a surefire recipe to having creaky knees and injuries.
Players of other sports went through the same process and once reaching their forties, some genetic loss began to kick in and once-committed sportsmen (and women) would hang up their football boots or running vests for a quieter life. As I grew up men and women in their fifties and sixties rarely looked as fit and healthy as many do today. Some of it is better preening but, there is often, also a better focus on staying fit through alternative means like cycling or going to the gym. Playing something like golf may keep you active but it won’t keep you fit because of the Primary Rule.
Primary Rule – Use it or lose it
The primary rule for the Aged Runner to remember is if you stop using it, you lose it. This is fundamentally the issue that causes most people to age poorly, put on weight, lose strength and stiffen up. They stop exercising as regularly or intensely as they once did. A sport like golf does little to push the muscles to their limitations, most of the time is spent walking which is easily achieved without too much extra exertion. Walking miles every day isn’t going to help you when your body is already efficient at it.
The more muscle your body has, the higher the “running costs” of living. Your body burns more calories simply by needing to keep that muscle alive. An athlete burns more calories sat on the sofa watching TV than the habitual couch potato who hasn’t toned their muscles up.
Many of the aches and pains older people suffer from are because the few muscles they do have are straining to do the simple tasks. A regime of getting stronger quickly gets rid of many minor aches and pains.
Your ageing body tempts you to stop doing difficult things and if you stop doing them, you decline quicker. Then it becomes a downward spiral as your body tempts you to do even less. You either “use it or lose it”.
Fit, healthy and running strong at fifty
Distance runners suffer a loss of top end speed because they rarely practice sprints or fast finishes. This is true of both young and old runners but becomes more noticeable with ageing. To access the faster speeds requires a dedicated programme of strides, hill sprints and short intervals to recruit and build the muscle. The occasional session is not enough to build up, it takes weeks of building session on session to maximise the gains.
Running is an activity which is very good at propelling the body forwards. While this keeps the lower body toned, what it doesn’t do is very much for the upper body (e.g. chest / shoulders / arms) unless you are a sprinter. The core muscles are worked if you have good running form. But with running being a straight ahead activity there’s also potential loss of strength for lateral movements (e.g. the types of movements that tennis, badminton or football players use regularly to sidestep or go left and right). These are all areas which will fall prey to the “use it or lose it” rule.
If your only sport is running, it is advisable to take up circuit, weight training or cross train to keep these other muscles active.
Secondary Rule – Recovery takes longer
The second rule for the Aged Runner is to understand that recovery takes longer. When you are young and full of hormones, you can train hard at least three times per week and recover from it. Sometimes more.
In middle and older age, you have to be sure the body has recovered enough before taking on the next workout. You’ll know you’re not getting enough recovery if you start feeling tired or getting aches or tightness setting in. The consequence of slower recovery is older runners cannot do as many workouts in a three month training period as younger ones. So the older runners have less speed or endurance when it comes to race day.
Another consequence of slower recovery is that injuries take longer to repair. If forced to take a break it can mean the athlete is no longer “using it” so potentially they are “losing it”. Once healthy, the temptation becomes to cram in training to try and rebuild quickly which is more likely to prolong the injury cycle. With a spiralling level of fitness, it’s easy to believe it’s purely an age-dictated decline rather than one which is in large part caused by impatience and bad habits.
Staying fast
Some decline is inevitable but it will be very gradual if you maintain good training habits. We saw in the Ageing Sprinter, there are men like Steve Peters or Charles Allie who at seventy years old are capable of running times that runners half their age do not achieve. The basis of all running events is strength which produces high cadences and long stride length which combine to produce high speeds. The people who are fastest over the shortest distances tend to be the fastest over longer distances.
Good training becomes about ensuring you do regular bouts of high intensity work like strides, hill sprints or short intervals to keep the fast-twitch muscle recruited. Having this muscle toned and active will also keep the fat off.
Ageing requires you to be patient and listen to your body, to understand how long it takes to recover. It is better to do one or two key workouts each week from a well-rested state than to do them badly in an under-recovered state.
You can’t be in denial about ageing taking some toll but, equally, simply throwing up your hands and accepting a big decline as inevitable is a mistake. Other people will be all too quick to tell you it’s age and encourage you to accept it but hopefully you now know better. If you’re to continue being fit, healthy and fast into older age, you have to find a realistic, common sense position somewhere between these extremes.
For the runners who’ve been to the pinnacle of the sport, of course the only direction is down. But for many runners who never achieved their potential at a younger age there is no reason to discount the possibility of improving as they get older. Even if they don’t improve, any decline can be minimised to allow them to keep running well into their seventies and beyond.
If you missed part 1 you can find ithere, part 2 is here, part 3 is here.
When we started Poole parkrun the attendance was well below two hundred runners each week which made it easy to get to know everybody. As the London Marathon rolled around in the April, I was excited to follow runners like Liz Yelling, who was aiming at an Olympic place, and Steve Way, who’d run three consecutive 2hr19s. But it wasn’t just the elites who caught my interest, I’d got to know runners of all abilities and using the online tracking kept an eye on a variety of people who’d be running from over four hours through to those attempting to run sub-3.
One of the success stories was Dave Cartwright, who ran a sub-2hr55 marathon on his way to being the fastest man in the 60-64 age group that day. Footage of him crossing the finish line was doubly amusing as he was shown on BBC TV patting model Nell McAndrew on the shoulder who, despite being over twenty years younger, had finished only just ahead of him. Now in his seventies, Dave is still running round Poole parkrun in under twenty-two minutes and completing Blackmore Vale half marathon in under 1hr40. These times are fantastic to most people and yet, they’re not close to the times of the best in his age group as we shall see.
Recently two V55s, Andrew Ridley and Duncan Cooper came 8th and 9th in a field of over seven hundred runners. Their times were 16:27 and 16:35 respectively. Andrew’s age-graded time equates to 95% but his efforts also give insight into how slow decline can be. He set his Poole parkrun PB of 16:15 having only just turned fifty, yet here he is seven years later running only twelve seconds slower. Barely two seconds decline per year. I know Andrew trains very hard to keep his speed intact for 800m racing.
Age group world records for 5000m
Time
Athlete
Date
Time
Athlete
Date
World Record
12:35
Joshua Cheptegei
14-Aug-20
14:07
Letesenbet Gidey
07-Oct-20
V35
12:54
Bernard Lagat
22-Jul-11
14:34
Edith Masai
02-Jun-06
V40
13:07
Bernard Lagat
20-Aug-16
15:05
Joanne Pavey
05-Jun-14
V45
14:24
Lucien Rault
19-Jun-82
15:56
Nicole Leveque
01-Jun-96
V50
14:53
Sean Wade
25-Mar-16
16:51
Gitte Karlshøj
23-Jun-09
V55
15:30
Keith Bateman
05-Jan-11
17:29
Silke Schmidt
27-Jun-15
V60
15:56
Yoshitsugu Iwanaga
14-Nov-20
17:59
Silke Schmidt
20-Sep-19
V65
16:39
Derek Turnbull
13-Mar-92
20:08
Kathryn Martin
28-Oct-16
V70
18:16
Ron Robertson
09-Jul-11
20:56
Angela Copson
25-Jun-17
V75
19:07
Ed Whitlock
23-Jul-06
23:31
Lavinia Petrie
28-Apr-19
V80
20:20
Jose Vicente Rioseco Lopez
04-Sep-21
25:40
Yoko Nakano
12-Sep-18
V85
24:04
Ed Whitlock
30-Jul-16
27:38
Yoko Nakano
23-Nov-21
V90
30:00
Yoshimitsu Miyauchi
20-Sep-14
—
V95
39:43
Antonio Nacca
04-May-19
—
Age group world records for the 10,000m
Time
Athlete
Date
Time
Athlete
Date
World Record
26:11
Joshua Cheptegei
07-Oct-20
29:01
Letesenbet Gidey
08-Jun-21
V35
26:51
Haile Gebrselassie
24-May-08
30:53
Joanne Pavey
03-Aug-12
V40
27:49
Bernard Lagat
01-May-16
31:25
Sinead Diver
28-Sep-19
V45
29:44
Kevin Castille
17-Mar-17
32:34
Evy Palm
04-Sep-88
V50
30:49
Sean Wade
01-Apr-16
35:06
Fiona Matheson
16-Oct-11
V55
31:52
Keith Bateman
26-Mar-11
36:47
Sally Gibbs
11-Nov-19
V60
33:40
Yoshitsugu Iwanaga
28-Nov-20
37:58
Mariko Yugeta
14-Nov-20
V65
34:42
Derek Turnbull
15-Mar-92
41:40
Angela Copson
05-Aug-12
V70
38:04
Ed Whitlock
09-Jul-01
44:25
Angela Copson
28-Jul-17
V75
39:25
Ed Whitlock
21-Jul-06
50:01
Melitta Czerwenka-Nagel
28-Aug-05
V80
42:40
Ed Whitlock
09-Jul-11
51:47
Yoko Nakano
06-May-18
V85
51:08
Ed Whitlock
12-Aug-16
1:26:15
Vladylena Kokina
21-Sep-14
V90
1:09:28
Gordon Porteous
17-Oct-04
—
Age group world records for the marathon
Time
Athlete
Date
Time
Athlete
Date
World Record
2:01:39
Eliud Kipchoge
16-Sep-18
2:14:04
Brigid Kosgei
13-Oct-19
V35
2:03:59
Haile Gebrselassie
28-Sep-08
2:19:19
Irina Mikitenko
28-Sep-08
V40
2:06:25
Ayad Lamdassem
24-Feb-22
2:19:52
Helalia Johannes
06-Dec-20
V45
2:14:23
Bernard Lagat
29-Feb-20
2:28:34
Catherine Bertone
23-Sep-17
V50
2:19:29
Titus Mamabolo
20-Jul-91
2:31:05
Tatyana Pozdnyakova
06-Mar-05
V55
2:25:56
Piet van Alphen
19-Apr-86
2:50:40
Jenny Hitchings
03-Nov-19
V60
2:30:02
Tommy Hughes
25-Oct-20
2:52:13
Mariko Yugeta
31-Jan-21
V65
2:41:57
Derek Turnbull
12-Apr-92
3:07:51
Kimi Ushiroda
15-Dec-19
V70
2:54:48
Ed Whitlock
26-Sep-04
3:24:48
Jeannie Rice
29-Sep-19
V75
3:04:54
Ed Whitlock
15-Apr-07
3:53:42
Yoko Nakano
23-Nov-12
V80
3:15:54
Ed Whitlock
16-Oct-11
4:11:45
Yoko Nakano
26-Feb-17
V85
3:56:38
Ed Whitlock
16-Oct-16
5:14:26
Betty Jean McHugh
09-Dec-12
V90
6:46:34
Ernest Van Leeuwen
06-Mar-05
8:53:08
Mavis Lindgren
28-Sep-97
Notes on Masters world records
All data was updated from Wikipedia in mid-June 2022. The aim is not to create a comprehensive set of records but to give readers an indication of what is possible. I will periodically update these when I can.
If you missed part 1 you can find ithere, part 2 is here.
Typically the 800m and 1,500m are the commonly run middle-distance races, but I’ve used the mile because it’s more relatable for most runners than the 1,500. This article also includes times for 3,000m which is on the cusp of being middle distance. For elite men, it takes around 7½ minutes and puts them on the edge of their aerobic limits whereas for women it’s almost a minute slower. But one reason why I’ve included them is to have three balanced articles containing records for three distances!
With all the women’s records from here onwards, many of the older age group times have good potential to be broken. Some of the over-ninety records don’t even exist. It was only in the 1980s that women began to compete at Olympics and World Championships in the longer distances and so many of the older age category records are held by women who started running later in life.
Katharine Switzer still running at Boston in her seventies
Of course there were women who ran distance before the eighties but they were fewer and far between. Katharine Switzer, who was the first woman to run the Boston marathon, was born in 1947 and opened the door for other women at the distance. In fact, many of the pioneers are younger and barely turning sixty at the time of writing.
The consequence of all this is the older age groups records have never been seriously trained for, or contested, by lifetime runners. To an extent this is also true of some of the older male records as few kept going past seventy but certainly with the women’s records we can expect some of their records to fall as the generation that started running distance in the late sixties are now hitting their seventies and the ones who followed them will have benefitted from increased participation and training.
Age group world records for 800m
Time
Athlete
Date
Time
Athlete
Date
World Record
1:40.9
David Rudisha
09-Aug-12
1:53.8
Jarmila Kratochvilova
26-Jul-83
V35
1:43.4
Johnny Gray
16-Aug-95
1:56.5
Lyubov Gurina
30-Jul-94
V40
1:48.1
Tony Whiteman
12-Jul-14
1:59.3
Yekaterina Podkopayeva
30-Jun-94
V45
1:49.9
Tony Whiteman
19-Aug-17
2:02.8
Yekaterina Podkopayeva
26-Jun-98
V50
1:58.6
Nolan Shaheed
13-May-00
2:12.5
Eva Trost
03-Aug-18
V55
2:02.9
Peter Oberliessen
07-May-16
2:19.6
Anne Gilshinan
08-Jun-19
V60
2:08.6
Nolan Shaheed
23-Apr-11
2:33.1
Lidia Zentner
14-Sep-13
V65
2:14.3
Earl Fee
18-Jul-95
2:39.6
Sabra Harvey
31-Oct-16
V70
2:20.5
Earl Fee
17-Jun-99
2:50.7
Sabra Harvey
19-Jul-19
V75
2:30.6
Jose Vicente Rioseco Lopez
18-Jun-16
3:07.3
Jeanne Daprano
23-Oct-11
V80
2:41.6
Jose Vicente Rioseco Lopez
30-Apr-21
3:25.8
Yolande Marchal
10-Oct-20
V85
3:06.7
David Carr
28-Jun-17
3:58.2
Yoko Nakano
23-Oct-21
V90
3:34.9
Earl Fee
22-Jun-19
5:01.3
Melitta Czerwenka-Nagel
30-Sep-20
V95
4:51.4
Antonio Nacca
09-Jun-19
9:30.5
Hollyce Kirkland
10-Jun-17
Age group world records for the mile
Time
Athlete
Date
Time
Athlete
Date
World Record
3:43
Hicham El Guerrouj
07-Jul-99
4:12
Sifan Hassan
12-Jul-19
V35
3:51
Bernard Lagat
06-Aug-11
4:17
Maricica Puica
21-Aug-85
V40
3:58
Bernard Lagat
25-Jul-15
4:24
Yekaterina Podkopayeva
09-Jun-93
V45
4:10
Davide Raineri
05-Sep-20
4:48
Yekaterina Podkopayeva
13-Sep-97
V50
4:20
Brad Barton
31-May-19
4:58
Nicole Weijling-Dissel
27-Aug-17
V55
4:35
Keith Bateman
18-Dec-10
5:08
Anne Gilshinan
07-Aug-19
V60
4:48
Håkan Eriksson
28-Aug-21
5:40
Lesley Chaplin Hinz
14-Jul-18
V65
4:56
Derek Turnbull
29-Feb-92
5:55
Angela Copson
19-Jul-15
V70
5:20
Joop Rüter
11-Jul-03
6:38
Sharon Gerl
06-May-18
V75
5:42
Ed Whitlock
28-Jul-06
6:58
Jeanne Daprano
21-Jul-12
V80
5:57
Jose Vicente Rioseco Lopez
18-Jul-21
7:35
Yolande Marchal
12-Oct-19
V85
6:40
Manuel Alonso Domingo
22-May-21
10:55
Blanche Cummings
20-Jun-15
V90
9:43
Gunnar Linde
17-Feb-19
12:49
Heather Lee
11-Jan-20
V95
11:56
Antonio Nacca
07-Apr-19
13:46
Colleen Millman
07-May-22
Age group world records for 3000m
Time
Athlete
Date
Time
Athlete
Date
World Record
7:21
Daniel Komen
01-Sep-96
8:06
Wang Junxia
13-Sep-93
V35
7:29
Bernard Lagat
29-Aug-10
8:28
Maricica Puica
07-Sep-85
V40
7:43
Bernard Lagat
14-Jul-15
9:03
Nuria Fernandez
24-Jun-17
V45
8:16
Vyacheslav Shabunin
17-Jul-15
9:17
Yekaterina Podkopayeva
22-Jun-97
V50
8:41
Christian Geffray
07-Jul-04
9:47
Gitte Karlshøj
19-May-09
V55
8:57
Keith Bateman
13-Nov-10
10:04
Silke Schmidt
10-Jul-15
V60
9:21
Yoshitsugu Iwanaga
26-Sep-20
10:29
Silke Schmidt
22-Aug-19
V65
9:47
Derek Turnbull
08-Feb-92
11:43
Kathryn Martin
03-Sep-17
V70
10:42
Siem Herlaar
02-Jul-99
12:13
Angela Copson
01-Sep-18
V75
11:10
Ed Whitlock
25-Jul-06
13:56
Yoko Nakano
21-Sep-12
V80
11:56
Jose Vicente Rioseco Lopez
04-Sep-21
14:27
Yoko Nakano
27-Oct-17
V85
14:13
Julian Bernal Medina
20-Feb-05
16:39
Yoko Nakano
23-Oct-21
V90
16:42
Yoshimitsu Miyauchi
19-Oct-14
—
V95
22:46
Antonio Nacca
16-Dec-18
—
Notes on Masters world records
All data was updated from Wikipedia in mid-June 2022. The aim is not to create a comprehensive set of records but to give readers an indication of what is possible. I will periodically update these when I can.
This series grew out of my attempts to write about Sports Psychology because it’s a topic which dominated my reading for a couple of decades. I wanted to impart the wisdom I’d learned along the way, but it’s a big topic ranging across all sorts of areas such as goal-setting, attributions, mental skills, relaxation and learning among many more; so being unsure of how to start writing it, I did the obvious thing and gave up for the time being!
During my research however, I looked up Dr Steve Peters to sharpen up on the details of his work. He’s famous for writing The Chimp Paradox; a best seller that brings together many of the ideas and methods he used while working as a sports psychologist for Great Britain Cycling to support their successful Olympic programme of the past two decades. Given his association with the cycling programme I was surprised to find out he’s been a highly successful Masters athlete in sprinting, to the extent that he won multiple gold medals at the World Masters Championships in the M50, M55 and M60 categories between 2005 and 2015.
Steve Peters competing in the British Masters
On the UK Athletics’ website, The Power of 10, there are records of his performances in the 100, 200 and 400 since 1996 when he was age forty-three up to pre-pandemic. It makes for interesting viewing to see the decline, or should I say lack of decline in his sprinting over that period. Even in his late sixties, he’s still running under 13s for 100m, under 26s for 200m and breaking a minute for 400m. There’s been a noticeable decline in the last couple of years which is more likely due to lack of competition or injury than age itself.
Would you have thought those times were possible for someone who was never an elite sprinter in the first place? At fifty I can’t even run the times he’s achieving in his late sixties. Not because it’s necessarily beyond me but because I’ve never trained specifically for them. How you train is a bigger determinant of your performance than your age.
Steve Peters is the World Champion for his age group, so he is obviously something of an outlier, but there are many former Olympians who are no longer competing who could be faster. Steve isn’t even the world record holder in his age categories. Below are tables of the age-graded world records for both men and women, updated in June 2022.
Age group world records for 100m
Time
Male
Date
Time
Female
Date
World Record
9.58
Usain Bolt
16-Aug-09
10.49
Florence Griffith Joyner
16-Jul-88
V35
9.87
Justin Gatlin
30-Jun-19
10.74
Merlene Ottey
07-Sep-96
V40
9.93
Kim Collins
29-May-16
11.09
Merlene Ottey
03-Aug-04
V45
10.72
Willie Gault
24-Jun-06
11.34
Merlene Ottey
12-Aug-06
V50
10.88
Willie Gault
07-May-11
11.67
Merlene Ottey
13-Jul-10
V55
11.3
Willie Gault
07-May-16
12.24
Julie Brims
13-Feb-21
V60
11.7
Ronald Taylor
04-Jun-94
13.63
Karla Del Grande
18-Jul-14
V65
12.31
Damien Leake
16-Jun-18
13.91
Karla Del Grande
11-Aug-18
V70
12.77
Bobby Whilden
06-Oct-05
14.73
Ingrid Meier
30-Jun-17
V75
13.25
Kenton Brown
03-Oct-20
15.03
Carol LaFayette-Boyd
04-Aug-18
V80
14.35
Payton Jordan
10-May-97
16.26
Kathy Bergen
06-Jun-21
V85
15.08
Hiroo Tanaka
25-Jun-17
18.49
Christa Bortignon
07-May-22
V90
16.86
Hiroo Tanaka
01-May-21
23.15
Mitsu Morita
06-Oct-13
V95
20.41
Frederico Fischer
30-Jun-12
30.16
Elena Pagu
28-Aug-21
Age group world records for 200m
Time
Male
Date
Time
Female
Date
World Record
19.19
Usain Bolt
20-Aug-09
21.34
Florence Griffith Joyner
29-Sep-88
V35
20.11
Linford Christie
25-Jun-95
21.93
Merlene Ottey
25-Aug-95
V40
20.64
Troy Douglas
09-Aug-03
22.72
Merlene Ottey
23-Aug-04
V45
21.8
Willie Gault
26-Apr-08
23.82
Merlene Ottey
27-Aug-06
V50
22.44
Willie Gault
07-May-11
24.33
Merlene Ottey
18-Jul-10
V55
23.24
Willie Gault
07-May-16
25.07
Julie Brims
07-Mar-21
V60
24.00
Ronald Taylor
10-Jun-94
28.11
Karla Del Grande
22-Oct-13
V65
24.65
Charles Allie
26-Jul-13
28.53
Karla Del Grande
05-Aug-18
V70
25.75
Charles Allie
21-Jun-18
31.3
Ingrid Meier
02-Jul-17
V75
27.73
Robert Lida
05-Aug-12
31.56
Carol LaFayette-Boyd
09-Sep-18
V80
29.54
Hijiya Hisamitsu
16-Sep-12
35.34
Kathy Bergen
06-Jun-21
V85
31.69
Hijiya Hisamitsu
17-Sep-16
41.58
Emiko Saito
12-Nov-17
V90
36.02
Hiroo Tanaka
23-May-21
55.62
Mitsu Morita
30-Jun-13
V95
48.69
Friederich Ernst Mahlo
10-Sep-07
1:12.99
Diane Friedman
22-Jul-17
Age group world records for 400m
Time
Male
Date
Time
Female
Date
World Record
43.03
Wayde van Niekerk
14-Aug-16
47.60
Marita Koch
06-Oct-85
V35
44.54
Chris Brown
30-May-15
49.46
Allyson Felix
06-Aug-21
V40
47.81
Enrico Saraceni
25-Jul-04
52.50
Geisa Aparecida Coutinho
09-Apr-21
V45
49.09
Allen Woodard
18-Mar-17
56.14
Angee Henry-Nott
23-Jul-21
V50
50.51
Juan Luis Lopez Anaya
16-Jul-21
57.66
Marie Lande Mathieu
14-Sep-07
V55
52.24
Charles Allie
12-Jul-03
59.36
Julie Brims
23-Jan-21
V60
53.88
Ralph Romain
22-Jul-95
1:04.3
Caroline Powell
12-Aug-15
V65
56.09
Charles Allie
18-May-13
1:08.0
Karla Del Grande
12-Jul-19
V70
57.26
Charles Allie
11-Sep-18
1:11.8
Barbara Blurton
10-Dec-20
V75
1:02.4
Guido Müller
28-Jun-14
1:19.5
Christa Bortignon
22-Aug-13
V80
1:10.0
Hisamitsu Hijiya
09-Sep-12
1:29.8
Rietje Dijkman
09-Sep-19
V85
1:17.1
Earl Fee
12-Jul-14
1:41.6
Emiko Saito
29-Apr-17
V90
1:29.2
Earl Fee
19-Jul-19
2:16.2
Melitta Czerwenka-Nagel
14-Sep-20
V95
2:21.8
Orville Rogers
12-Jul-13
3:21.0
Diane Friedman
27-Jul-19
It’s my guess that most runners, male or female, can’t even run the times being set by the 80-year-old women; let alone run close to the times for their own age or gender. It’s only when these runners get into their eighties that the times begin to noticeably degrade and I suspect this is as much down to circumstance, as it is ageing. There are fewer of these runners competing and most of them probably took it up later in life.
Lots of facts and figures so far but here’s a chance to enjoy watching M70 Charles Allie in action over 200m.