Everybody talks about goal setting for success. Setting SMART goals, DUMB goals, setting targets. I have always been a focused person and goal setting came naturally to me. I never needed to specifically set or write down goals, I always just wanted to achieve excellence. To be the best I could at whatever I was doing. It turns out this was a mistake for me.
The problem is I was always pushing my limits. There’s nothing wrong with that in principle, but it meant I often left myself exhausted. And what I didn’t realise is that physical exhaustion impacts you emotionally.
Eventually I’d reach a state of emotional burnout and give up. Giving up didn’t happen immediately but if I was trying to reach a target and I wasn’t moving closer to it, I’d start to get discouraged. All the effort I was putting in wasn’t reaping any dividends. To an extent I could rationalise this as I know things take time and need patience. It’s the same reason some people will give MAF training a go for far longer than they should without progress.
I’d never get discouraged immediately as I’m resourceful and would look for ways to change things or put in more effort. When I played sports which had a break between seasons, these would allow me to recharge my batteries. But if the lack of progress went on too long, burnout would ensue.
With runners, quite often their change of direction or resourcefulness is to try a new race distance. If all they’ve done is 5Ks, they might move up to the 10K then the half marathon then the marathon. Each of these changes means they change how they train especially for the longer distances where they might be running for two or three hours for the first time; covering distances of up to twenty miles. While they might be nervous come race day, it’s easy to get inspired about doing something different.
This isn’t to say goal setting is a bad thing – it can be really useful for creating motivation to follow training plans and, if or when training stops working it might give impetus to look for alternative ways to kickstart improvement.
But my attitude has changed. I guess it’s partly down to being old and knowing that however hard I try or train I will never achieve the peaks I might have been able to attain when I was younger. Now my driver is curiousity.
I’m simply interested to know how far I can get at something given the constraints of training time and an ageing body’s slower recovery. For example when I went to the gym over the winter, I was curious to know whether I’d still be able to squat 130kg like I was doing 15+ years ago. In fact, within twelve weeks I’d surpassed that.
What I like about not setting targets is that there is no failure. Yet in being curious about the process and what is happening I learn something, and I see that as a success.
If I offered you the chance to take two mins off your 5K time in a couple of months – I’m sure you’d jump at the chance. Of course this depends on how fast your current 5K time is, but it’s exactly what I did when I went from a 5K parkrun time of 25:03 on 1st February to 23:11 on 15th March. Speaking accurately that’s not quite two mins improvement but it’s also much less than two months! And I did it through almost pure aerobic training.
That improvement is going from a pace of 8:03/mile to 7:24/mile – which is about 39secs – an average of 6-7secs/mile per week. Think about that if you did this training for three months you might expect to be running a mile per minute quicker than you were. What’s the catch? Why doesn’t everybody do this?
Anyone who’s read about aerobic training and especially a system like MAF training will know the literature says improvement will be slow. They interpret this to mean it will take months. They interpret it to mean that when 2-3months later they’re still doing the same pace for the same heart-rate, they just need to be a little more patient. That’s a wrong interpretation – if they’re months down the line with no change, then it’s clear indication their training is ineffective.
Here’s what aerobic training takes time really means …
Aerobic training log
On Saturday Feb 1st I ran 8:03/mile. On Sunday I did a 3-mile run at 8:05 pace. On Monday I did a 2-mile run at 7:45/mile. On Tuesday I did a 3-mile run at 8:11 pace. On Wednesday I did a 3-mile run at 7:58/mile. On Thursday it was another 2-mile run at 7:38 pace. On Friday it was a 3-mile run at 8min/mile.
On Saturday I returned to parkrun and ran 24:46. On Sunday I ran three miles at 8:37/mile. On Monday it was a three mile run again at 8:36/mile. On Tuesday it was two miles at 8:24/mile. On Wednesday, three miles at 8:26/mile. On Thursday three miles at 8:17/mile. On Friday it was the two mile run at 8:05/mile.
On Saturday I didn’t go to parkrun but ran from home for three miles at 8:31/mile and then did the same three mile run on the Sunday at 8:08/mile. On Monday it was the two mile run at 7:42/mile. On Tuesday it was three miles at 8:25/mile. On Wednesday the three miles came in at 8:01/mile. On Thursday it was the two mile run at 7:46/mile and on Friday a three mile run which was paced at 8:28/mile.
Are you bored yet? Keep on reading there’s still another three weeks of running data to go through.
On Saturday I returned to parkrun and ran 24:21 which is 40+ seconds than three weeks ago. Improvement is already showing up. Sunday I went out and ran three miles at 8:20/mile pace. On Monday I ran two miles at 7:31/mile. Tuesday was three miles at 8:08/mile. Wednesday’s run was the same three mile run, this time at 7:53/mile. Thursday I was back on the two mile run at 7:31/mile. And on Friday I did three miles at 8:23/mile.
On Saturday I was back at parkrun running 23:52. Another surprise thirty second improvement over the previous week. Sunday’s run was three miles at 8:00/mile. On Monday it was the two mile run at 7:26/mile followed by three miles at 8:15/mile on Tuesday. Wednesday was three miles at 7:53/mile and then on Thursday it was the two mile run at 7:36/mile. Friday was clearly a tired leg day as the three miles were run at 8:58/mile.
The tiredness meant I gave parkrun a miss on the Saturday allied to it being a wet and windy morning. Nonetheless I still did three miles from home at 8:37/mile pace. On Sunday it was another three miles at 8:22/mile. Monday was the two mile run at 7:43/mile. Tuesday, three miles at 8:35/mile with Wednesday’s three miles coming in at 7:56/mile. Thursday I did another two mile run at 7:41/mile and Friday was 7:58 pace on a three mile run.
On Saturday March 15th I went to parkrun. My legs felt great and I ran 23:11. Almost two minutes quicker than six weeks before.
If you didn’t bother to read all that in detail, I don’t blame you. I could have produced it in a graph or table to give quick visual understanding but I deliberately wrote it longwindedly to make a point. To read it properly requires great patience. And that’s what runners need if they’re going to get aerobic training to work for them.
The training consists of the same thing day-in, day-out with slight variation in pace. Some days are faster; some days are slower. There is no clear pattern of progression other than at the parkruns. Not every runner has the luxury of a local parkrun to measure their progress.
On top of the basic detail I give you, bear in mind this is just the running. Think about what you do with the other twenty-three hours of your day. Getting up. Breakfasting. Work. Lunch. More work. Evening meal. Watching Youtube or television. Sleeping. My week includes going to the gym on Mondays and Thursdays. That’s why Tuesday and Fridays are always notably slower. If you’ve been promised aerobic training will make you faster then you’re eager to see results and those other activities are taking up time before you can go for your next run.
Living through days after day of just doing simple aerobic runs where the pace might be a little faster or slower than the day before can be tough as it doesn’t bring clear results. It’s not like starting a weekly speed session where you will see quick gains. For example last summer when I was running a 440m lap of my road I went from 6:01/mile to 5:01/mile in three weeks.
There’s a temptation for runners – “I now feel better off the bit of aerobic training I’ve done and just jogging around every day surely won’t help forever; perhaps it’s time to drop in some speedwork as I know it’s worked for me in the past”.
They say “a watched pot never boils” but that’s what runners doing aerobic training often do. They keep checking, comparing their times and paces looking for that improvement. If they use a heart-rate monitor they’ll be including that data.
All this is a great example of where you have trust the process. Set the target of doing a block of aerobic work then just get out and do the runs and don’t worry about the results. In a few weeks’ time you’ll see they’re getting faster.
When coaches mean say “aerobic training takes time” I’ve tried to show you what they mean. You should begin to see some kind of improvement in three weeks whether that’s a faster pace, a lower heart-rate or just feeling better on the runs. It might take six weeks to begin to see notable change but if, by 8-10 weeks everything is still in the same place then your training isn’t effective. It’s time to change direction.
I needed to get stronger if I was ever to run faster. This was my reason for signing up to the gym. At home I have some weighted vests, dumbbells and other equipment for the workouts I’ve been doing the past few years but I realised if I wanted to get stronger, I needed to lift heavier. That presented a choice – either buy more equipment which would take up space in my house and get used relatively infrequently or join the gym.
Ahead of returning to the gym I began to get excited thinking back to the times I’d lifted weights before. There were two primary periods – at the start of the 1990s when I was a teenager and in 2007-08 in my late thirties. I remember being able to bench press multiple reps at 90kg as a teenager and squat reps of 130kg in the Smith machine in my thirties. Now in my fifties would I still be able to achieve these standards?
While these might have been classed as goals, I wasn’t interested in setting specific goals. I had a vague goal – get stronger and stay healthy. Consequently the first few weeks in the gym were spent very carefully setting up for squats, deadlifts and bench press in the free weights area. Partly making sure I understood how to set up the equipment correctly but also prioritisiting technique over lifting heavy weights. I also didn’t want to get sore by trying to lift anything too heavy, too soon.
In the first session I found myself comfortably half-squatting 8 reps of 50kg and bench pressing 5x60kg. Four weeks later I was doing some half squats at 110kg and struggling to bench a couple of reps at 70kg.
My priorities have changed over the months as I identified weaknesses. For example, with the bench press, I attempted to press 80kg at Christmas and failed. I didn’t make the progress I was hoping to make considering I’d been able to do 65kg on my second session. So I moved to using the Chest Press machine to see if that would help. It didn’t and when I attempted 80kg again in my final session I got stuck and had my spotter give me a little bit of help to get it past the sticking point. Maybe next year.
Similarly I went to the gym intending to strengthen glutes and quads using squats and deadlifts. I stopped deadlifting at Christmas because I had a pulled a muscle in my back and need it to recover.
Injuries like that have been a part of this gym training but not while there. Both sides of my back (rhomboids) and both hamstrings have been strained but these injuries occurred while doing sprints. I believe it’s because I’ve strengthed the muscles and am now putting forces through other parts of the body which aren’t used to it. Injuries led me to add exercises to strengthen the adductors, abductors and hamstrings (leg curl) which can only be beneficial.
With squats my initial aim was to push the weight as high as possible over the training period. I reached 149kg just before Christmas in the Smith machine and added another 10kg just after but unracking the bar began to feel like it was squashing my torso even just standing with the weight on my shoulders. At the same time I realised my deep squats, where I could barely do a single effort at 70-80kg, were too low by comparison and since the New Year I focused on upping this. It’s been very successful as I managed to do a 100kg deep paused squat in my final week and felt there was capacity for another rep. I still occasionally worked the top end and managed to do multiple sets and reps of quarter-squats at 160kg in the free weights area.
On my final leg session I repeated my so-called Seb Squat Challenge which I did with half squats at Christmas and this time attempted it with deep squats. I completed it successfully but it might well have been the toughest session I’ve done. The ten reps at 85kg left me gulping for breath, just like when I’ve been sprinting!
Going to the gym twice per week has been enjoyable without feeling like I’m overdoing it. With my sessions on Mondays and Thursdays, it’s allowed me to go to parkrun on a Saturday with relatively fresh legs. While I didn’t have a benchmark run from before the weights I ran 23mins in my first month, the same again at Christmas, slipped to 25mins while injured and then have rebuilt it to 23mins with increased daily runs of 2-3 miles but no speedwork outside of very short sprints.
And this non-movement in parkrun time is while having putting on about 15lbs / 7kg / 1-stone in weight. My legs have grown by 2 inches / 5cm; as has my chest and arms – I look more like a rugby player than a runner. I detailed how my gym shorts ripped last month and when I put my tailored shorts on again a few weeks back they no longer fitted, they were far too tight. It’s been like that with most of my clothes.
It was never my aim to get bigger but I guess it’s inevitable as you add strength. I deliberately did low rep sets which are meant to avoid muscle hypertrophy. I particularly didn’t want to add upper body weight which doesn’t provide much, if any, benefit to running and maybe that’s why my bench press never improved back to my teenage days. But I was never in this to look good, it was always about functional training – providing muscle for power and health.
There is no doubt it has been an excellent investment of my time. As a general estimate I’ve added 20-30% strength in all the exercises I’ve been doing. I notice when I’m running I feel very stable around my core, my legs feel strong and that there is more to come.
While I could continue going to the gym over the summer, my aim is now to focus on turning the strength into power and rebuilding my lacate threshold to run faster over sprints and parkrun. I’m also interested to see how my body reshapes without any gym work, how much of the strength I’ve developed is retained and how quickly I can reaccess it next winter.
If there was any doubt my glutes and thighs have grown in size since going to the gym, it was proved when I split my shorts doing deep squats the other day! Fortunately I had a spare pair with me and was able to see out the session.
Deep squats, which are a staple of power lifters and gym goers, where you go ass-to-grass and your bum is lower than parallel, thereby putting you in ‘the hole’, aren’t found to serve much purpose for runners.
Yet having pushed my squat up to 160kg in the Smith machine in early January, I found my deep squat was barely half of this. I was straining to do even 1 rep at 70kg despite the Smith machine channelling all my force into the lift rather than having to worry about stability or balance.
The disparity between my 1/4 squat and deep squat seemed too much and after Christmas I decided to focus on improving my depth. For one thing, everything you can do from a deep squat means you can do that weight at 1/2 and 1/4 squat too. I also suspect the disparity is because there is some underdeveloped muscle somewhere in my legs/hips which would benefit from strengthening by getting lower.
I know when I unracked 160kg it was the first time I’d felt like my back might not like the squats. I felt a little bit of strain there and as I lowered the bar, I was really conscious I couldn’t go deeper than about 8-10”. Pushing back up to standing was less of an issue than the lowering phase. I was never in any danger because I always set the safety bars on the equipment, and while they have tested twice with crashing out, I don’t want to attempt any lift with a gung-ho mindset.
While the focus has been on improving my deep squat, every three weeks or so I slot in a heavy session to remind the body it’s still needed. In February that saw me do four sets of 6x150kg in the free squat area which suggests with the right training I’d be able to do 1 rep of 180kg. While these heavy lifts might only be a 1/4 squat at best – perhaps getting 30cm or so of depth – I’m still very pleased with them and what it might contribute to max velocity.
There is a suggestion that a 1/4 squat should be able to lift 30-45% more than a deep squat which works out as at between 124-138kg. Yet my latest deep squats see me only just able to do 3 reps at 90kg and I’m struggling with poor form such as hips lifting first.
This is why I’m working on the deep squat at the moment. The disparity is still too wide. I’m barely able to deep squat my body weight and from what I’ve read, focusing on 1/4 and 1/2 squats doesn’t become effective until you can deep squat at least 1.5x bodyweight which would be the upper end of the 124-138kg range.
Realistically I know I’m not going to get there in the month I have left at the gym during my winter membership but I’m certainly feeling the benefits of strength training and setting myself up to run faster through the summer and then get back to the gym to further improve next winter.
It’s January and a whole year of running is ahead. Perhaps you’ve already entered some races and begun training. Elite runners and their coaches certainly have. In fact they won’t only have planned out what to do this year – they’ll know what they will be doing next year and beyond. This year there are World Championships and again in two year’s time then in 2028 it’s the Olympics – probably the high point of runners’ careers.
But those are simply long term plans, there’s a preplanned year of racing in 2025 which they’re expected to take part in. During the winter they’ll be doing cross country, maybe indoor racing if the facilities are available, and then in the summer it’s the track season and Diamond League with the World Championships being the competition they aim to peak for.
Elite runners and their coaches are always thinking ahead – they have to. How exactly they divide up the training year really depends on what they’re targetting but generally in the autumn they are doing a base of mileage to prepare the body for what comes later. Many modern athletes, particularly the faster track athletes, will be doing some weight training to build strength and stability to support the miles they’re running.
Marathoners who have quit the track will be focused on running two marathons per year – one in spring, another in autumn. The Marathon Majors see Boston and London in April; while Berlin, Chicago and New York take place between the end of September and early November – this neatly allows marathoners to run a Spring and Autumn marathon – six months to train for each. Again those six months will be broken up into phases of base, pre-competition and tapering leading into the race.
Even though their training plans are focused towards major competitions, runners will be participating in other races. Some may be selected for international competitions like the European Championships, Commonwealth Games, World Cross Country championships or World Indoors. The marathoners, focused on their six month plan, might take part in a half marathon, both as a way to test their fitness and earn some extra appearance money.
But when the best runners take part in other races, their approach is different to that of a recreational runner; they won’t be looking for their fastest possible time they’ll be racing tactically and just looking to be the first across the line. Ideally they’ll want to win with the minimum expenditure of effort and fatigue in their legs. They may even run in a less than ideal state; as training for their goal race may only make minor allowances for a lesser race and certainly won’t see them running at their strongest. In marathons, runners who realise they aren’t going to win often drop out around the 20-mile mark to avoid unnecessarily fatiguing their legs thereby allowing them to recover quicker and potentially even reprioritise an alternative 10K, 10 mile or half marathon coming up just a few weeks later.
My own running followed a fairly standard pattern for many years. I entered half marathons in spring and autumn; 10Ks in the summer and preceding Christmas. That gave me a structure to the year which played out as doing base work after the September half marathon through to the end of October. Then a couple of months specifically training for the 10K. Then in the New Year repeat that cycle with trying to build on what I’d achieved at the 10Ks and preparing for an April half marathon. When the sunshine returned and my legs had recovered from the half marathon I would resume speedwork and prepare for the summer 10Ks before again turning back to do the miles to prepare for the autumn half.
This has all changed with my return to the gym. As I wrote in my previous post, my focus has shifted onto rebuilding leg strength through this winter. Two trips to the gym each week – Monday and Thursday – which allows decent recovery time in between. On the other days I’ve been working on my sprint speed – small sessions with short intervals and drills to improve form and efficiency. This format partly developed after an injury in July and when I returned I carefully tested the injury with short runs. I found I was enjoying the freedom this gave me. Where once I had always run every day for at least half an hour, currently I don’t even run for that long on any day. A 25min parkrun is currently my long run for the week!
My intention is to start rebuilding my running mileage when my gym membership finishes. Given it rarely gets that hot where I live, I won’t mind doing all the longer runs during the spring and summer. In the meantime it has been lovely not to have to train in the high winds, cold and rainy days of winter as I’ve done for the past decade. It’s given me a chance to mentally refresh myself after a decade-plus of running almost every day.
From time to time, this refreshed attitude tries to entice me into starting the rebuild now, but I remind myself the priority is the work I’m doing at the gym. It’s impossible to have your maximum speed/strength at the same time as your maximum stamina/endurance. If I start doing significant volumes of running, I may begin to impact my strength gains. When I leave the gym in March, I want to have maximised my strength as best possible with the training time I’ve had available. Once the summer begins I will be looking to convert that strength into power and therefore speed. The running will become the priority again and I will look to maintain whatever strength I’ve gained this winter.
There is no right way to divide up your training but all good athletes divide it up in some way because they recognise they can’t work on all the things they need to do at the same time. Sometimes they need to improve their speed, sometimes it’s their stamina, sometimes it’s their endurance. Having a training plan allows runners to organise all the different sessions they’re going to do so that they arrive at their goal race at their strongest, fittest and ready to race.
If you’re unsure how to develop training plans and set long term goals then maybe I can do that for you. If you’d like Coaching then please click over to Contact Mewhere we can start discussing how you can become a better runner.
Seb Coe is one of the legends of British running. Now known as the head of World Athletics and the organiser of the 2012 London Olympics, anyone who watched athletics in the early 1980s remembers his rivalry with Steve Ovett. The 1980 Moscow Olympics are one of my earliest sporting memories where Coe entered as world record holder for the 800m while Ovett hadn’t been beaten in the 1500m for three years. While the races resulted in two golds for Britain; it was a surprise when they each won the race the other was favoured in.
Coached by his father, Peter Coe; Seb won golds in 1500m at both the Moscow and Los Angeles Olympics. In 1979 he broke three world records, the 800m, 1500m and mile, in 41 days. In 1980 he broke the 1000m record then bettered it to 2:12.18 in 1981. That same year he also reduced his 800m WR to 1:41.73 – a record which lasted until August 1997.
It’s a highly successful career and his father’s training philosophy of improving lactate threshold through low volume, high intensity training became a training model which endured into the 2000s. It’s only later been understood that Coe’s low volume of fifty miles per week wasn’t really low volume as it neglected to count mileage done during warm-ups and cooldowns and explains why later attempts to follow a genuinely low volume approach led to a dearth of western success in middle distance for the following decades.
It’s clear Peter’s coaching was able to get the best out of Sebastian and he goes into great detailing about all aspects of training in his book – “Better Training for Distance Runners”. This isn’t a book I recommend to the average runner but, as a coach, it is a mine of information which I’ve regularly returned to.
This winter I’ve rejoined the gym with the express purpose of getting stronger and trying to maximise my muscle recruitment – mainly for running but with the view it is one of the most important things you can do to stave off the effects of ageing.
I’ve been focusing my weight training on the advice in running books like Peter Coe’s as well as reading decent articles and watching videos on YouTube from trusted sources. I’m not interested in Bro science or what the influencers have to say. When I need advice on lifting I chat to, Rich, a powerlifter at the gym who squatted 390kg / 850+ lbs at his peak.
In Chapter 6 of his book, Peter Coe explains the benefits of weight training and in describing squats on page 280 he gives this example …
“Seb Coe (130-lb body weight) doing six sets of half-squats, the number of reps will be 15, 15, 15, 10, 10, and 5, with the weight increasing by 10 lb per set set from 140-190 lb. Admittedly this is a challenging session – more than 11,000 lbs moved in 70 lifts – but over the years Seb became an accomplished weight lifter, and while this training session was not a “killer”, nevertheless it would have been accompanied by only an easy run that day and also the following day.”
To summarise and convert from Imperial to metric it is
Reps
LB
KG
15
140
63.5
15
150
68
15
160
72.8
10
170
77.3
10
180
81.8
5
190
86.3
990
2178
Although I’ve only been back in the gym for less than three months, I’ve already been squatting significantly heavier weights than these albeit not necessarily deeply. Having chatted to Rich he tells me that a half squat is when the thighs are parallel to the ground and while I find this difficult to judge accurately when looking straight on into a mirror, I’ve been able to half-squat reps at 100kg perhaps more. My heavier squats which reached 160kg after twelve weeks are certainly only 1/4 squats at best.
While Rich tells me that he would recommend only ever doing deep squats and working up from those, he is a powerlifter not a runner whereas Pete Magill states in his Speed Runner book “You don’t have to squat so low that your thighs are parallel to the ground. While a lower squat will help acceleration, a quarter squat gives you more bang for your max velocity buck.”
With Christmas week seeing the gym closed for a couple of days and it marking the three month mark since I started training, I wanted to see whether I could match what Seb was doing. As my gym’s weights are in kilograms I decided to keep things simple and work at 65, 70, 75, 80, 85, 90 kg with the same rep counts as he was doing.
I felt confident I could achieve this as I’ve done 10x90kg half squat; there was however a little doubt at the back of my mind as to how I’d find the 15rep efforts in the beginning because I never do sets past ten reps at lighter weights. While the overall set of lifts seemed like they would be easy to do, I wasn’t taking anything for granted.
Squats are always the first thing I do at the gym and this session – on the Monday before Christmas – wasn’t going to be any different. I warmed up for squats in the usual way by doing three deep reps with an empty 20kg bar which both begins to warm me up but also ensures I’ve set the equipment, in particularly the safety bars, in the right places. While I didn’t expect to need them for this, it doesn’t cost anything to put them in place. Once I’d done 3x20kg I then proceeded to do 3x40kg, 3x50kg and 3x60kg which all felt very simple and like I was barely training. I then took a few minutes before starting Seb’s Squat Challenge!
The first set of 15x65kg (143lb) felt easy. My legs were warmed up and it was a set well within my capabilities so I just did the 15 reps straight off and then added 2.5kg to each end of the bar for the 15x70kg (154lb). I took a minute or two rest and was then able to go through this second set with only a momentary pause around the 8th rep.
Having loaded the bar to 75kg (165lb) for the next fifteen reps I had confidence that if I could get through this things would get easier on the remaining sets. Unracking the bar I began to notice it was feeling a little heavier and once again paused around the 8th or 9th rep than as I reached the 12th I knew I had the strength for the last three reps but also that I would need to take a second or two extra rest at the top before starting the next rep. Things were beginning to get a little tougher.
At 80kg (176lbs) I felt confident in the knowledge that I now only needed to do ten reps which I have regularly done before. It proved relatively easy as did the next set at 85kg (187lbs). By now the bar was definitely feeling heavier when I unracked it but having unracked as high as 160kg I expected this.
With the final set only requiring five reps at 90kg (198lb), I even felt confident enough to repeat my first rep as I could see I didn’t go deep enough. Even though I’d already done 60+ reps it might have been the easiest set of the lot.
I’d done it – mission accomplished! Of course there is no official Seb’s Squat Challenge it’s just something I wanted to see if I could do. All told it took me about twenty mins with breaks of 2-3mins between sets. There was the occasional rep where I dug deeper but in all honesty it never felt that difficult. Most of the sets were done with barely a pause. The one remaining doubt is whether I was going deep enough. A half squat should see the thighs parallel and, if I were being hyper-critical, I’d like to have gone an inch or two deeper but it was close enough.
And yet there’s a catch. Seb Coe weighed 2/3rds of what I do – 59kg vs 90kg. Where the final set was about 1-1/2 time his body weight, it’s equal to mine. To truly take on this challenge, I’d need to up the weights and set them to the same percentage of body weight as Seb did. I know I’m not ready for that, and while I can probably get close to deep enough for five half-squats at 135kg, it’s all the preceding lifts which would be make it tough. Even so, maybe when I’m finishing up at the gym in March I will give it a go!
Weight training can be an important supplement to run training and if you decide to start doing squats – even just air squats with body weight or with a weighted vest, remember that Pete Magill states “Pause when your thighs are near-parallel or parallel to the ground – a quarter squat for maximum velocity training and half squat for acceleration”.
If, like me you end up at the gym, I think it’s worth working through all ranges of motion at different times. One day I train at getting used to squatting the heaviest weight I can and this might only allow me to confidently do a quarter squat. The next time I train I might focus on achieving half squats which are inevitably at a lighter weight but allow my legs to recover from the very heavy day. At the end of each session I usually do a set of the deepest squats I can, ass-to-grass as Rich terms it, where my thighs are touching the backs of calves – again these will be even lighter but useful in adding support and confidence for heavier lifts.
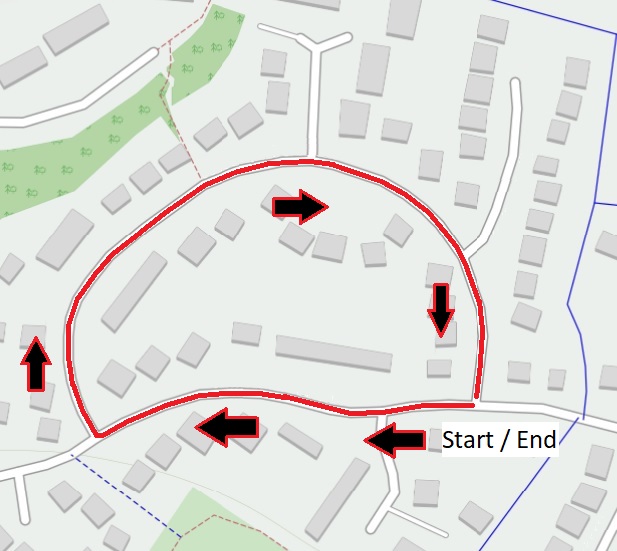
On Mondays, I run a couple of laps of my road all-out. I live on a crescent to which its two ends join back to a connecting road which makes for a nice loop. I begin with a couple of laps from my house to warm-up and in truth it’s not a particularly good one as I often go too fast and it only lasts about four minutes. After this I walk to the far end of my road where I’ll be starting from. This takes 3-4 minutes and gives just enough time for any excess from the warm-up to be gone.
Arriving at the corner I reset my watch then take a look around to check for traffic as I’m intending to run in the road. It’s quietly residential with only the occasional car or delivery van every five minutes or so. I compose myself one final time and then hit the Start button. I’m focusing on a good push off with high cadence and small steps. As the weeks have gone by cadence has been rising. Last week it reached 214-218 in the early going; whereas less than two months ago I could barely hit the 190s. Depending on fatigue it might drop back for a week but the general trend has been one of increase. Somewhere in the dim and distant past I could hit the 220s so I’m hoping I will get back there and then go beyond with dedicated focus and training.
From the corner there is a nice straight taking under thirty seconds to reach a corner where I instinctively slow because it’s almost 90 degrees. Even though I’m running on the road and can take it wide there is always an element of slowing as the initial burst of energy is gone, there’s a very slight uphill and it’s a change of direction. Sometimes there’s also a headwind to make things even tougher. If there’s ever a tailwind I’ve never felt it helping out.
Around the corner and I’m trying to accelerate again. This is helped by a downward stretch and from here onwards it will be the curve of the crescent back to where I began, no more corners to negotiate. I pass my house at about the halfway mark and then it’s fairly flat. As I reach the 45-50s mark I begin to feel what 400m runners always feel as the arms and legs are getting heavy from lactic build up and the coordination is going. Of course, I’m also breathing hard and all my body’s signals are telling me to slow down. There’s often a moment around here where I’m beginning to wish I’d never started and I have to tell myself to “hang on”, “it’s not much further” and “I can’t let myself down now”. Self-coaching at its finest.
My GPS always shows this stretch as the fastest part of the lap after the initial start. As the clock ticks past a minute, the road begins to grade upwards and I’m vigilant for any oncoming traffic as my sight around the bend is hidden by walls and hedges. Drivers often come into the road quicker than they should for a residential road. My ears are listening out too. I’m ready to jump on the pavement if needs must.
The final metres are a short upsection. I have to engage more muscle to finish this. It comes right at the time where my body is begging me to slow. My mind urges me to keep going, no quitting with the end so close. Crossing my imaginary finish line / starting point, I click the Lap button and then begin to walk. It’s already been tough to this point yet in some ways worse is to come.
On finishing my legs are aching a little, my shoulders too sometimes and most notably my breathing is fast and short. In the early season I can usually stay jogging after an effort but, as the weeks go by and fitness improves, I start having to walk. On shorter sprints it becomes a standing recovery.
The peculiar thing is while I’m breathing very hard at the end of the run, about ten seconds after finishing it gets worse. In those first ten seconds, I’ve counted my breathing to be at about 60-65 breaths per minute; but then at the ten second mark it goes haywire. I begin to find myself gulping for air, unable to get it in quick enough. I’ve counted my breathing rate rising to the equivaent of around 150 breaths per minute and this lasts up to about the thirty second mark. It then begins to slow and has normalised by about a minute yet even then I’ll still be panting for the next few minutes.
You’d assume this breathing difficulty is down to lack of oxygen. It’s not. My heart-rate monitor tells me my heart-rate is in the 150s. This is not my max. At a recent parkrun, while running a 23 minute parkrun (i.e. paces slower than 7min/mile) I saw my heart-rate creep up into the 160s and peak at 172 despite not putting in a sprint finish. It’s clear if my heart wanted to circulate more oxygen it could, but it doesn’t. I can only surmise that it’s because sprints are highly anaerobic and therefore the body is trying to reset all the by-products which have built up. Its trying to expel carbon dioxide from the lungs, not supply more oxygen to the muscles.
With my first effort completed I now do a walking recovery. As I wrote, the first minute sees me breathing very hard and my legs hardly have the energy to move. Things begin to ease and by about three mins I’m beginning to get back to normal. I’m still breathing a little harder though.
When the walking lap has been completed (taking over five minutes) it can be tough convincing myself I’ve recovered enough to run another effort fast. The anaerobic energy system half refills in thirty seconds, fully refills in three minutes. The problem is it takes the body significantly longer to clear out all the waste products from these high intensity efforts. Sprinters typically budget a minute’s recovery for every ten metres run. If they run 200m, that means twenty minutes of standing around. Few distance runners will do all-out sprints or hang around that long; particularly in winter.
What I find on the second effort is that once again the first thirty seconds are fine then it begins to bite. And it bites even worse at the halfway point and the legs get heavier and the co-ordination goes. It’s notable when I look at the post run data that I’m able to start the second effort quicker and this in turn builds the lactate up quicker. By the end of the second effort, I feel worse than I did the first. The saving grace is I can just walk home. The knowledge that there is no more to do is wonderful. It’s why I make the session short because it allows me to go hard for two efforts giving them both my best effort.
The ‘oxygen debt’ is tough after this second effort and even when I arrive home five minutes later I can still be panting. I can go upstairs to change and I will still be sweating. On some occasions when I’ve either hit new territory in the session or when my legs are really fresh, I’ve found myself still feeling the effects half an hour after I began. And I definitely sleep well that night!
The previous parts of this series can be accessed by clicking on the following links where they will open in new windows. Part 1, Part 2, Part 3, Part 4.
I wrote this series of posts because there is an idea out there that 180 steps per minute is the perfect number to run at and I want to investigate. Only this past weekend, I came across an interview with Chris McDougall, author of Born to Run, where he stated “For perfect running form you should be running at 90 strides per minute” therefore 180 steps.
The idea that there’s a perfect onesize fits all cadence for people of different heights, weights, speeds and abilities has always seemed wrong to me. Maybe it’s because I’m tall and, when I started running I counted my cadence at 150 steps per minute on easy runs rising to mid-150s when I picked up the pace but hardly ever going over 160 in a race. I always assumed it would increase as I got faster, after all I was rarely running any quicker than 7min/mile. On reflection these lower numbers are partly because my form was poor and I was overstriding yet even today with improved technique I’m still running easy runs in the mid-160s. It might reach 180 at 6min/mile and when I pick up my pace to 5min/mile I start to hit the 190s. When I sprint it rises above 200spm. This is the progression we glimpsed for some of the elites.
To recap, the trend for elite cadence data is that very high cadences are only seen over short distances. As the race distance gets longer, cadence drops until for the majority of runners it reaches 180. That gels with the ‘180-rule’ idea and the drop-off makes sense because the shorter races are run at lower speeds and we know speed is created through a combination of steps and stride length. Sprinters have both high cadences and very long strides – neither of which is sustainable for a distance runner. It is only at the end of a distance race where we see endurance athletes raise their cadence and/or stride length to sprint for the line.
Typically we see the 100m sprinters have cadences in the 280-300 range, 400m runners are 220-260, the middle distance runners at 190-210 and long distance is in the 180-190 range.
It’s very clear that if you want to be a sprinter or middle distance runner it’s going to involve high cadences – well over 200spm. Since writing the post on sprinters, I’ve been reading a book on sprint mechanics which began its research in the the early 1980s and now leads to the fastest sprinters training to create high cadences. But its author is very clear to point out this must not occur at the expense of stride length. An adequate stride length is still required. It points out that when some sprinters have pushed their cadence too high (over 300spm) this has been detrimental to their speed.
Whether or not this increase of cadence, which has worked for sprinters, can validly be transferred to long distance running is debateable. For one thing, if it were transferrable then we might expect to already be seeing numerous elite distance runners with cadences well over 200. Whereas the data I covered found only one long distance runner operating at over 200spm. A reason for this may be because sprinters achieve quicker cadence through use of the hip flexors, a relatively weak muscle group, and therefore distance runners would struggle to maintain high cadences for long periods. Even in the 400m we see the cadence of elite sprinters fatiguing and this is in a race lasting 45-50 seconds.
With most recreational runners being interested in races between 5K and marathon in length, the long distance data is most relevant. Thirty-two runners were detailed – eight men and women in their respective 10,000m and marathon races – and we see a different picture to the one presented by Jack Daniels in his book.
At the 1984 Olympics Daniels recorded only one runner having a cadence below 180, out of the fifty he surveyed. His method was very basic and done with the naked eye but, he has also conducted proper scientific research so while observing from the seats is not perfect; his findings are still worthwhile. Ultimately what’s been important throughout these posts has been to get a rough idea of what runners are doing, not coming up with a perfect number.
By contrast the data used in this series of posts, which is taken from the World Athletics reports, has a high standard of scientific rigour to it. High speed digital cameras filming an area which has been carefully measured and calibrated then using computers to analyse the film. This data showed nine of the distance runners (about 25%) had cadences below 180.
For me, the most interesting of these is seeing Mo Farah’s cadence at 173-178 while running at 4:15-30/mile. He is not just a run of the mill athlete, he won multiple Olympic and World titles, which highlights that while 180 may be something to aim for, it is not a prerequisite for success. While his best time in the marathon (2hr05) is not close to the best of the best; he won the 2018 Chicago marathon which is one of the majors.
Recreational paces
What we aren’t seeing from any of this data is what the elites are doing at typical recreational paces which are often 8min/mile or slower. In the marathon, we have data from the men at both the 30 and 40km marks and we see their cadence dropping as they slowed towards 6min/mile. That would suggest that if they run at even slower paces their cadence will drop further. Perhaps.
The marathon data also has three runners who are slower than 6min/mile which is a pace many decent club runners can achieve. The cadences are 175, 185, 186spm – so there is nothing conclusive there.
Rereading a later edition of Daniels’ Running Formula book he mentions that he treadmilled an Olympic marathon gold medallist for their cadence. At 7min/mile it was 184, at 6min/mile 186 and at 5min/mile had reached 190. This is very much in line with what we see in how the cadences drop off in the men’s marathon data reviewed. Yet it is also very different to what Mo Farah is doing in the 10,000m where he is running significantly faster than with lower cadences.
One reason often given for creating a high cadence is to avoid injury. There is some logic, particularly for marathoners, where a higher cadence means a short stride and less vertical displacement i.e. they don’t go as high in the air and therefore don’t hit the ground with as much force. Their effort is used to go more horizontally. A good example of this is Tirunesh Dibaba in the 10,000m race; where she has a high cadence especially when sprinting in the home straight (228spm) and she must be barely leaving the ground with each step. Some years before this race she had moved up to the marathon and so the lower impact is seen as beneficial when you’re running well over one hundred miles per week.
Final thoughts
Most recreational runners are interested in the distance races – anything from 5K to marathon and maybe beyond. When they go out on easy runs they are doing paces of 8min/mile or slower; some of the decent club runners are closer to 7min/mile.
We have no specific detail on what the elites do at these paces but if your cadence is already in the 180-190 range – when you run faster you will need to increase your stride length to get significantly quicker. It may be possible to increase your cadence towards 200 but the data suggests it won’t go much higher. To improve stride length you are going to have to work on strength and speed making sure you are getting full hip extension.
If your cadence is below 160 at slower paces, it may not be an issue particularly if you are tall or muscular but it may be something to consider looking at. Often the advice about 180 cadence is intended to stop runners from overstriding which can lead to injuries. Certainly if you have recurring injuries then it may be worth looking at video of yourself running in conjunction with considering whether to increase cadence.
Ultimately though, the cadence data is there to support your running; not be an end goal. Every step you take on a run is a combination of stride length which involves ground contact time, air time, vertical displacement among other things. All these variables interact. Changing one will affect others.
Elite runners run how they feel comfortable. Sometimes it is a high cadence, sometimes it is a low one. Some like Mo Farah have a long stride with low cadence, others like Tirunesh Dibaba are getting their feet to contact the ground as often as possible.
If you enjoyed these articles why not take a look at the ones I wrote about Stride Length – part 1 and part 2.
In the Introduction I detailed how, in his Running Formula book, Jack Daniels states that his survey of runners at the 1984 LA Olympics found everyone in events over 3000m had a cadence of 180 or greater – with one exception.
In this post, I’m looking at the 10000m and marathon races from the 2017 World Championships and finding more anomalies than Jack discovered. To read about the cadences of Sprinters and Middle-Distance runners – click the links.
Men’s 10,000m
The race was won by Great Britain’s Mo Farah in 26:49.51s with Uganda’s Joshua Cheptegui and Kenya’s Paul Tanui finishing less than a second behind him. Twenty-two runners had started the 25-lap race and while the early going was slow the race eventually settled down to running laps at around 4:15-30/mile pace. Gradually runners were dropped from the lead pack and at the bell Farah was leading a group of six; it was here that he kicked and covered the final lap in under 56 seconds.
The technical report on the race covers the first eight finishers and provides their data in the home straight on the 15th lap. We are given the Step Rate when the race has settled down and the runners are running at around 4:30/mile.
Step Rate (Hz)
Cadence (SPM)
Farah
2.89
173
Cheptegui
3.04
182
Tanui
3.07
184
Muchiri
3.44
206
Yimer
3.23
194
Kamworor
3.09
185
Hadis
3.07
184
Ahmed
2.85
171
Average
3.09
185
Table 1 – Step Rate (Hz) and Cadence (SPM) data for top 8 finishers in Men’s 10,000m
I’ve done the conversion from Step Rate to cadence and we can see there is a huge range from 171 up to 206spm. Mo Farah is just a couple of steps higher at 173 than Canada’s Mohammed Ahmed (171). It’s clear a sub-180 cadence was no hindrance to Farah because he won the gold and Ahmed finished 8th in 27min02 only fifteen seconds behind.
Many of the athletes are running at Jack Daniels’ predicted 180 cadence with Kenya’s Jemal Yimer (194) and Ethiopia’s Bedan Muchiri (206) being the notable exceptions. While the focus of these posts has been to ignore stride length; I think it is useful to recognise Muchiri’s is 1.75m here.
The technical report also provides greater detail (table 2) for the three medallists with their cadence from five points in the race including the home straight as they battle for gold at top speed.
Lap 5
Lap 10
Lap 15
Lap 20
Lap 25
Lap 5
Lap 10
Lap 15
Lap 20
Lap 25
Farah
2.93
3.09
2.89
2.97
3.33
176
185
173
178
200
Cheptegui
3.01
3.04
3.04
3.05
3.45
181
182
182
183
207
Tanui
3.10
3.15
3.07
3.12
3.45
186
189
184
187
207
Table 2 – Step Rate (Hz) and Cadence (SPM) data for Men’s 10,000m medallists
What we see is that, for much of the race, Mo Farah is operating at sub-180 cadence while Cheptegui and Tanui are operating at 180-190. It’s when they reach the final lap of the race that they put the afterburners on and here we see all three runners increase their cadence. Mo Farah continues to have the lowest of the three albeit he is achieving a cadence of 200 at this point.
Women’s 10,000m
The women’s race was run differently to the men’s 10000m. While initially both races began slowly with a pack of runners bunched together; it was about twelve minutes into the women’s race on the 9th lap that eventual winner Almaz Ayana took charge.
While the 8th lap had been completed in 1:15 (5min/mile) she now moved to the front and upped the pace with the next two laps coming in 1:08 and 1:07 (4:35-40/mile). Gradually she pulled away from the the rest of the field, lapping back markers and went on to win gold finishing almost a minute ahead of the other medallists. There was a tussle between Tirunesh Dibaba (silver) and Agnes Tirop (bronze) over the last lap with Alice Nanowuna following in fifty metres behind them.
The cadence data (table 3) is a little more conventional for the women with all the runners between 180-192 yet there is one exception – Kenya’s Alice Nawowuna who is down at 173. The race commentators mention Nawowuna is the tallest of the three Kenyans which could explain a longer stride.
Step Rate (Hz)
Cadence (SPM)
Ayana
3.14
188
Dibaba
3.17
190
Tirop
3.20
192
Nawowuna
2.88
173
Krumins
3.07
184
Infeld
3.02
181
Cheptai
3.07
184
Huddle
3.17
190
Average
3.09
185
Table 3 – Step Rate (Hz) and Cadence (SPM) data for top 8 finishers in Women’s 10,000m
As with the men’s data, the sample is from midrace approaching 6000m where they are running at about 4:50-55/mile with the exception of leader Ayana who is at 4:35 and Molly Huddle at 5:03.
Below in table 4 we see the race breakdown for the medallists and cadence increases in the final lap on the home straight. Ayana is unchallenged so never has to hit her highest gear. The battle between Dibaba and Tirop is close and we can see their cadences are very different. At this stage of her career, Dibaba had been running marathons for three years and it is notable how smooth her stride is sprinting against Tirop. At 228, Dibaba’s turnover in this finishing straight is as good as, or better, than many middle distance runners while throughout the rest of the race she is above average by hitting the low 190s.
Lap 5
Lap 10
Lap 15
Lap 20
Lap 25
Lap 5
Lap 10
Lap 15
Lap 20
Lap 25
Ayana
3.06
3.03
3.14
3.03
3.23
184
182
188
182
194
Dibaba
3.09
3.19
3.17
3.23
3.80
185
191
190
194
228
Tirop
3.08
3.09
3.20
3.03
3.26
185
185
192
182
196
Table 4 – Step Rate (Hz) and Cadence (SPM) data for Women’s 10,000m medallists
Marathon
The 2017 World Championship marathons were held on a four lap street circuit around London with each lap measuring about 10km. While there were some long straights on the course, it also had a number of corners to be negotiated which either required runners to run wider or adapt their pace. It was a true head-to-head race in the sense of trying to beat other runners rather than going for a time.
The marathon data is possibly the most interesting data in this whole study because we have two sets of data for the men recorded at around 30km and 40km and, with runners tiring in both men’s and women’s races, we get a glimpse of them running at paces we might expect from above average recreational runners.
The men’s race was won by Geoffrey Kirui of Ethiopia in 2:08:27. Table 5 shows his cadence on lap 3 is 191spm where he is recorded running at 4:50/mile. Having taken the lead at 35km and opened up a lead over silver medallist Tamirat Tola, he had slowed by the 40km mark. By this point he was running at 5:25/mile and his cadence had dropped to 186spm.
Lap3
Lap4
Step Rate (Hz)
Cadence (SPM)
Pace (per mile)
Step Rate (Hz)
Cadence (SPM)
Pace (per mile)
Kirui
3.19
191
4:50
3.10
186
5:25
Tola
3.05
183
4:58
3.00
180
5:51
Simbu
2.91
175
5:22
2.89
173
5:27
Hawkins
3.12
187
5:21
3.23
194
5:11
Kipketer
2.85
171
5:29
2.86
171
5:42
Meucci
3.14
186
5:29
—
—
—
Ghebregergis
2.96
178
5:37
2.99
179
5:49
Wanjiru
3.20
192
5:26
3.08
185
6:10
Average
3.05
183
5:19
3.02
181
5:39
Table 5 – Men’s marathon data at roughly 30 and 40km
Of the other six runners who data was recorded for, only Callum Hawkins increased his pace in the last 10km – this was consistent with him moving up in the race from 8th place to finish 4th. To run 10secs/mile quicker his cadence increased from 187 to 194.
Meanwhile Tola, who slowed by almost a minute per mile, dropped his cadence from 183 to 180; similarly Wanjiru who slowed to over 6mins/mile had his cadence drop from 192 to 185. The other three runners see a small drop in pace – Simbu slows by 5secs/mile – a relatively low cadence of 175 drops further to 173; Kipketer’s cadence remains the same as he slows by 13secs/mile and the one anomaly is Ghebregergis who fractionally increases Step Rate while slowing by 12secs/mile. I’d be inclined to see this as remaining the same with the 0.01Hz change attributable to the normal variations which occur while running.
The women’s marathon was won by Rose Chelimo in 2:27:11 – not a particularly fast time by modern standards – equating to an average pace of 5:37/mile (35min per 10K). But it was closely contested with the top four runners finishing within ten seconds of each other.
Unlike the men’s race, there is only data provided from the 4th lap – the 40km mark – and at this late stage of the race we see in table 6 a variety of paces from the 5:28/mile of USA’s Amy Cragg who is almost a minute per mile quicker than Kirwa and Dibaba at 6:17 (barely quicker then a 20min 5K parkrun).
Lap4
Step Rate (Hz)
Cadence (SPM)
Pace (per mile)
Chelimo
3.31
199
5:41
Kiplagat
3.07
184
5:41
Cragg
3.29
197
5:28
Daniel
3.09
185
5:37
Demise
2.95
177
5:56
Kirwa
3.10
186
6:17
Kiprop
2.75
165
5:58
Dibaba
2.92
175
6:17
Average
3.06
184
5:51
Table 6 – Women’s marathon data at roughly 40km
We see a significant range of cadences despite all eight finishers running 2hr27-28. Gold and bronze medallists, Chelimo and Cragg are hitting the 190s with Kiplagat, Daniel and Kirwa in the mid-180s – all in line with Jack Daniels’ findings.
Yet there are three runners with sub-180 cadences. There are Ethiopia’s Shure Demise and Mare Dibaba (unrelated to Tirunesh) in the mid-170s. And then there is Kenya’s Helah Kiprop running at only 165spm. Finishing seventh, a minute behind Chelimo this was far from her best race which was a Marathon Majors win in Tokyo in a time of 2:21:27. Knowing she can run a marathon around 20secs per mile faster opens up the question of whether she would achieve that pace through a quicker cadence, longer stride rate or a combination of the two. I would expect her to be capable of a quicker cadence as 165 is extremely low compared to all the other runners detailed.
Collating the data into table 7 for all 32 runners across the four races we see a symmetrical range of cadences where the majority are in the 180s – which aligns with the average cadence data being 183-185spm. But it also highlights that over a quarter of these runners can be running at sub-180 cadences.
< 170
170s
180s
190s
200+
Cadence (SPM)
1
8
14
8
1
Table 7 – number of runners for each cadence grouping
While the variety of paces goes from 4:15/mile in the men’s 10,000m down to 6:15+/mile in the women’s marathon – we should remember these are all world class athletes who are training many hours per week and getting excellent coaching. They are running times many of us will only dream of and among these runners having a sub-180 cadence is not holding them back.
We’ve also glimpsed cadence at slower paces – the marathons have three men running at 5:49, 5:51, 6:10 per mile and four women running at 5:56, 5:58, 6:17, 6:17 – these are the paces for a 18-20min 5K. The cadences for these seven runners are 179, 180, 185 and 177, 165, 175, 186.
This suggests, but is by no means definite that, as elite runners move towards recreational paces their cadence can be lower than 180. It’s also backed up by how when the men slowed in their race, four of six runners had lower cadences, while Callum Hawkins increased his pace by increasing his cadence as did each of the 10000m medallists.
In the final post in this series I will summarise what the cadence data can tell us about running and what it might mean for you as a recreational runner. Click here to go to it.
Having looked at sprinters, our attention now turns to the middle distance runners. Traditionally competing in the 800, 1500 and perhaps the 3,000m; the research hit a problem – World Athletics didn’t report on any of these races at the 2017 World Championships. Fortunately, as I was writing this series of posts, the 2024 European Championships in Rome were taking place and so, I had to be like Jack Daniels, and do my own bit of counting. Using the televised footage I was able to replay certain sequences of the races to get an idea of the cadences involved.
I watched each race through in its entirety to get an understanding of how it played out and identify which runners were near the front of the pack and of whom I could get an unobstructed view. Often the TV director regularly switched between close-ups and long shots of the race, on different runners and by necessity switching to different cameras positioned around the track. Typically I managed to count the paces for 15-20secs and then multiplied that up to get a value per minute. Being manually calculated in this way, I could be out by a few steps per minute but we’re interested in getting a rough idea of the numbers involved – not doing an exact scientific breakdown!
Having identified one runner for each race I then did a lap-by-lap breakdown for them. This was necessary because longer races can start off slowly, building the pace and then finishing in a mad dash to the line. We might expect different cadences as the race pace picks up or lulls. With only one runner analysed per race it’s by no means a perfect look at the cadences we see but it’s an indication.
800m
The men’s final was won by France’s Gabriel Tual in 1:44.87 and it was his data I collected for the two lap race. The first lap took 53sec which is around 3:30/mile and his cadence was 197spm.
The 2nd lap was marginally quicker at 52sec but in the home straight Tual put in a big sprint finish and this was what I measured. I watched and rewatched the video multiple times as my first calculation had him registering a cadence of 234spm, a second viewing it was 224 and I finally settled at 228spm. This is a significantly higher value than the rest of his race but what we expect when runners sprint.
For the women’s 800m, I used Great Britain’s Keely Hodgkinson as my subject. She’s run the fastest time in the world this year and is in with a chance of winning gold at the Paris Olympics. She actually won the gold at these championships, but I recorded her cadence in the semi-final where she ran 1:58.08.
The first lap of the race was run in 57.6s followed by a slightly slower second lap of 60.4sec. The cadence for the first lap was 202spm, rising to 206spm on the second. This might seem strange given the second lap was slower but from 400-600m the runners slowed before Keely accelerated away on the final bend where I measured her second lap cadence.
What we can see from both the men’s and women’s race is it’s not unusual for 800m runners to have cadences of over 200 during the main race. And with speed being a key requisite for its runners, it’s no surprise to see that a runner like Tual has the ability to hit even higher cadences.
1,500m
Norway’s Jakob Ingebrigtsen is arguably the star of male middle distance track racing at the moment. It was his data (table 1) I captured during the heats of the men’s 1,500m event. Due to the race being a 300m lap followed by three full 400m circuits, it is difficult to know where to place the short ‘lap’ when trying to ascertain split times.
Cadence (Spm)
Pace (per mile)
Lap 1
189
3:57
Lap 2
186
4:09
Lap 3
193
3:49
Lap 4
208
3:37
Table 1 – data for three medallists nearing the finish line
Being a heat, it was an easy race for Jakob and he seemingly jogged off the start line such that everyone was ten metres ahead of him. From there he sat at the back of the pack avoiding trouble until the final 300m when he overtook everyone and finished first. We can see his cadence is steady around the 186-194 mark while he was at the back and then when he accelerated it went over 200.
The women’s final where I obtained the cadence data was run even more tactically with the first two laps at a relatively sedate pace before it began to wind up and Ireland’s Ciara Mageean came through to take the gold. Even though the pace was a little slower we see that the cadences were all lower throughout.
Cadence (SPM)
Pace (per mile)
Lap 1
184
4:30
Lap 2
185
4:34
Lap 3
180
4:13
Lap 4
204
4:01
Table 2 – Ciara Mageean’s cadence at 1,500m
So that’s cadence for middle distance runners. Bear in mind, the data provided here is limited to four individuals – Gabriel Tual, Keely Hodgkinson, Jakob Ingebritsen and Ciara Mageean. There’s strong reason to believe its representative for all elite runners but there will be some individual variance with others.
If this data shows us anything in particular it’s that the faster you run – the higher your cadence. Intuitively that makes sense. We see the “magic 180” figure is being adhered to at paces around 4:30/mile and when middle distance runners break into a sprint they go over 200spm but never approach the cadence of the short sprints.
In the next post – we will look at the cadence of long distance runners. Most recreational runners only compete in these types of races so it should provide interesting data. Click here to go to it.