A.I. coaching

Let’s play a game …

Here are the times from my last ten 5K parkruns – 23:31 … 23:16 … 23:06 … 23:27 … 22:54 … 23:06 … 23:37 … 23:37 … 22:50 … 23:16.  

What’s your prediction for my next 5K time?

If you said somewhere around 23 minutes – well done. Maybe you went for 22:45 to give me a booost – I wouldn’t be against that.

But would you have said 21:38? I certainly wouldn’t.

Yet Strava does.


Strava recently gave me a month’s free premium membership and they seem to have embraced AI with gusto. Among the features is its willingness to Predict Race Times. Despite having the perfect info available – weekly 5K – Strava is reckoning I can run over a minute faster. Clearly I can’t unless I change my training and then their prediction will probably change.

Race predictions

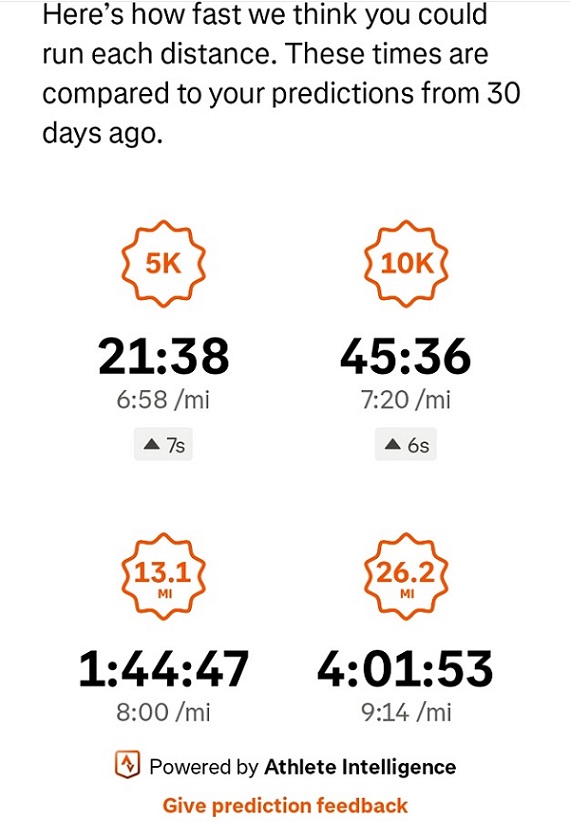
Last month I ran a 6:48 mile to celebrate Banister’s Mile. I know that’s not fast but I’ve been concentrated on building strength in the gym and working on very short distances – I expected my aerobic base to erode and it did. But if I take a look at Jack Daniels’ VDOT tables he estimates a 6:49 mile equates to a 23:09 5K which is relatively close to the 22:54 I ran at parkrun a few days later.  It’s not perfect but it’s not frustrating me into thinking I can run over a minute quicker than I’m capable.

Looking at the other predictions – the 10K of 45:36 is essentially double this Season’s Best for 5K – so that isn’t going to happen. I reckon half marathon at 1hr45 is reasonable and JackD’s VDOT suggests 1hr46 although I wouldn’t be surprised to see myself slip to about 1hr50 given I haven’t run over five miles in almost a year.

VDOT predicts a 3hr40 marathon which is very unlikely and Strava’s 4hr time is probably closer to what I’d achieve. But again, if I entered a marathon tomorrow, I doubt I’d come close to either time because I’d wilt and be walking from fifteen miles. If I trained properly for the distance, I’d feel more confident about VDOT’s prediction; the Strava prediction would then be too slow but it would probably update itself with the training.  But if it has to keep revising times as the training changes then that seems a little disingenuous – rather like the person who tells you “Oh I knew that” after you read out the answer to the trivia question they had just given up on.


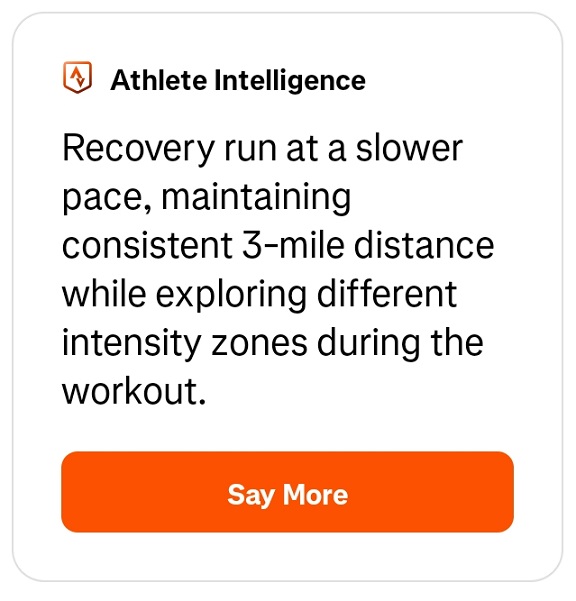
With each run you upload there is Athlete Intelligence feedback to tell you about the run or workout you’ve just done. For example, this is what it stated for the run I’d just done at time of writing  …

Recovery Run

It’s a bit bland.

And it’s only half correct.

It correctly managed to figure out I do the same route most days (“maintaining consistent 3-mile distance”) and it correctly figured out whether this was faster or slower than usual (“at a slower pace”) but the last sentence (“while exploring different intensity zones”) is complete rubbish. I went out at an easy, recovery pace and maintained the same intensity throughout. What did happen is that I ran up some hills which caused me to run slower (but using the same effort/intensity) and down some hills which caused me to run faster (still using the same effort/intensity) and under some trees which will have messed around with the GPS.

As for the first couple of words (“Recovery run”)  Strava had enough intelligence to take this from the title of my run!  When I changed the title to “Steady” the summary changed likewise. It really wasn’t rocket science to figure that out although when I changed the title back to “Recovered” with a deliberate -ED ending it went back to calling it a “recovery run” and when I tried “Interval session” it ignored that.

I decided to look at what it had to say about previous days. For example here’s an interval session …

This is a pretty good description of what I’d done but what does this final bit (“and a challenging mixed-pace run.”) say or mean? They’re just empty words describing what it thinks I’ve done but not what it really was – warm-up, intervals with rest breaks, warmdown. Technically it’s a mixed-pace run but not like going out and doing a proper fartlek session where you mix the paces up.

I looked back to a speed development session where I sprinted four efforts of 5 seconds followed by further efforts lasting 10seconds, 15seconds and 25 seconds. Between the efforts I walked back to where I started, stood around and had long rests. It ended up taking about 25mins to do seven efforts. Here’s what Strava had to say …

Sprints

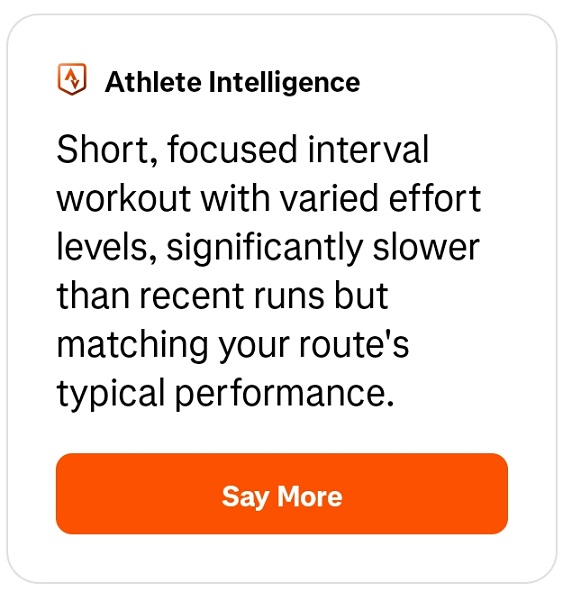
It got the first line correct but not much else. There really were no varied effort levels, it was max effort from start to finish on the sprints. And I’m guessing it thinks this was “significantly slower” because the 0.7 mile of total sprinting and walking comes out at 12+ min/mile. Compared to a recovery run then this is significantly slower but of course it is – the aim and structure of the session is totally different.

Here’ s what it said about a 23:16 parkrun …

parkrun

Well that’s strange, I didn’t do any intervals – I ran a 10min warmup, a 5K parkrun, a 5min warmdown. And the parkrun was 25secs slower than my Season’s Best the week before so it can’t have been a “route personal record”.

What can I say? It all sounds like unintelligent garbage to me.


Of course I don’t help Strava much by having an old Garmin watch which doesn’t feature many of the latest variables and I stopped wearing a heart-rate monitor months ago. But I run just about every day and upload my data to Strava – there’s almost ten year’s worth of data about my running for Strava to crunch. And yet I don’t find it’s telling me anything useful.

That said, I haven’t investigated their Runna coaching service – why would I? I coach myself and know how to train others for results. If you need an individual plan then I can help you but equally standard plans have been available in magazines and on the internet for years – and while I’d expect Runna to adapt depending on how your training is going (which is what I do with the runners I coach), I’m not sure how good it is at that. I also question its ability to motivate – I’ve known a few people try to follow coaching plans given to them by their Garmin watches but have yet to hear of anyone who succeeds or even completes the programme.


At the moment AI feels rather like “cut & paste” software. It feels like the gym assessment I used to get where it would state BMI is the relationship between your height and weight, with your value of [Insert value] kg/m2 shown above in Illustration 1. Your value places you in the [Insert rating] category. However, it is worth noting that BMI doesn’t take into account factors such as muscle and lean body mass.  Lots of description with just a couple of personalised bits of information added in.

I remember how these five or six page documents initially impressed me but after retesting, I came to realise that they were just padding out my numbers with waffle. Eventually all I did was look at the graphs and numbers.  I suppose AI has an advantage because it can rephrase the same information in different ways thereby giving the impression for longer that it has something important to say.

I’m sure AI will improve in coming years and when that happens I’ll probably be out of a job. But one of the reasons AI will continue to improve is that it continues to scour the internet. I receive a significant number of hits from AI tools which are reading my blogs and trying to make sense of them.

In the meantime if you want personalised coaching from a real human being – this far I’ve not used AI in my blogs or plans – then click here to Contact me.

The Truth About Cadence Part 5

The previous parts of this series can be accessed by clicking on the following links where they will open in new windows. Part 1, Part 2, Part 3, Part 4.

I wrote this series of posts because there is an idea out there that 180 steps per minute is the perfect number to run at and I want to investigate. Only this past weekend, I came across an interview with Chris McDougall, author of Born to Run, where he stated “For perfect running form you should be running at 90 strides per minute”  therefore 180 steps.

The idea that there’s a perfect onesize fits all cadence for people of different heights, weights, speeds and abilities has always seemed wrong to me. Maybe it’s because I’m tall and, when I started running I counted my cadence at 150 steps per minute on easy runs rising to mid-150s when I picked up the pace but hardly ever going over 160 in a race. I always assumed it would increase as I got faster, after all I was rarely running any quicker than 7min/mile. On reflection these lower numbers are partly because my form was poor and I was overstriding yet even today with improved technique I’m still running easy runs in the mid-160s. It might reach 180 at 6min/mile and when I pick up my pace to 5min/mile I start to hit the 190s. When I sprint it rises above 200spm. This is the progression we glimpsed for some of the elites.

To recap, the trend for elite cadence data is that very high cadences are only seen over short distances. As the race distance gets longer, cadence drops until for the majority of runners it reaches 180. That gels with the ‘180-rule’ idea and the drop-off makes sense because the shorter races are run at lower speeds and we know speed is created through a combination of steps and stride length. Sprinters have both high cadences and very long strides – neither of which is sustainable for a distance runner. It is only at the end of a distance race where we see endurance athletes raise their cadence and/or stride length to sprint for the line.

Typically we see the 100m sprinters have cadences in the 280-300 range, 400m runners are 220-260, the middle distance runners at 190-210 and long distance is in the 180-190 range.


It’s very clear that if you want to be a sprinter or middle distance runner it’s going to involve high cadences – well over 200spm. Since writing the post on sprinters, I’ve been reading a book on sprint mechanics which began its research in the the early 1980s and now leads to the fastest sprinters training to create high cadences. But its author is very clear to point out this must not occur at the expense of stride length. An adequate stride length is still required. It points out that when some sprinters have pushed their cadence too high (over 300spm) this has been detrimental to their speed.

Whether or not this increase of cadence, which has worked for sprinters, can validly be transferred to long distance running is debateable. For one thing, if it were transferrable then we might expect to already be seeing numerous elite distance runners with cadences well over 200. Whereas the data I covered found only one long distance runner operating at over 200spm. A reason for this may be because sprinters achieve quicker cadence through use of the hip flexors, a relatively weak muscle group, and therefore distance runners would struggle to maintain high cadences for long periods. Even in the 400m we see the cadence of elite sprinters fatiguing and this is in a race lasting 45-50 seconds.


With most recreational runners being interested in races between 5K and marathon in length, the long distance data is most relevant. Thirty-two runners were detailed – eight men and women in their respective 10,000m and marathon races – and we see a different picture to the one presented by Jack Daniels in his book.

At the 1984 Olympics Daniels recorded only one runner having a cadence below 180, out of the fifty he surveyed. His method was very basic and done with the naked eye but, he has also conducted proper scientific research so while observing from the seats is not perfect; his findings are still worthwhile. Ultimately what’s been important throughout these posts has been to get a rough idea of what runners are doing, not coming up with a perfect number.

By contrast the data used in this series of posts, which is taken from the World Athletics reports, has a high standard of scientific rigour to it. High speed digital cameras filming an area which has been carefully measured and calibrated then using computers to analyse the film. This data showed nine of the distance runners (about 25%) had cadences below 180.

For me, the most interesting of these is seeing Mo Farah’s cadence at 173-178 while running at 4:15-30/mile. He is not just a run of the mill athlete, he won multiple Olympic and World titles, which highlights that while 180 may be something to aim for, it is not a prerequisite for success. While his best time in the marathon (2hr05) is not close to the best of the best; he won the 2018 Chicago marathon which is one of the majors.

Recreational paces

What we aren’t seeing from any of this data is what the elites are doing at typical recreational paces which are often 8min/mile or slower. In the marathon, we have data from the men at both the 30 and 40km marks and we see their cadence dropping as they slowed towards 6min/mile. That would suggest that if they run at even slower paces their cadence will drop further. Perhaps.

The marathon data also has three runners who are slower than 6min/mile which is a pace many decent club runners can achieve. The cadences are 175, 185, 186spm – so there is nothing conclusive there.

Rereading a later edition of Daniels’ Running Formula book he mentions that he treadmilled an Olympic marathon gold medallist for their cadence. At 7min/mile it was 184, at 6min/mile 186 and at 5min/mile had reached 190. This is very much in line with what we see in how the cadences drop off in the men’s marathon data reviewed. Yet it is also very different to what Mo Farah is doing in the 10,000m where he is running significantly faster than with lower cadences.

One reason often given for creating a high cadence is to avoid injury. There is some logic, particularly for marathoners, where a higher cadence means a short stride and less vertical displacement i.e. they don’t go as high in the air and therefore don’t hit the ground with as much force. Their effort is used to go more horizontally.  A good example of this is Tirunesh Dibaba in the 10,000m race; where she has a high cadence especially when sprinting in the home straight (228spm) and she must be barely leaving the ground with each step. Some years before this race she had moved up to the marathon and so the lower impact is seen as beneficial when you’re running well over one hundred miles per week.

Final thoughts

Most recreational runners are interested in the distance races – anything from 5K to marathon and maybe beyond. When they go out on easy runs they are doing paces of 8min/mile or slower; some of the decent club runners are closer to 7min/mile.

We have no specific detail on what the elites do at these paces but if your cadence is already in the 180-190 range – when you run faster you will need to increase your stride length to get significantly quicker. It may be possible to increase your cadence towards 200 but the data suggests it won’t go much higher. To improve stride length you are going to have to work on strength and speed making sure you are getting full hip extension.

If your cadence is below 160 at slower paces, it may not be an issue particularly if you are tall or muscular but it may be something to consider looking at.  Often the advice about 180 cadence is intended to stop runners from overstriding which can lead to injuries. Certainly if you have recurring injuries then it may be worth looking at video of yourself running in conjunction with considering whether to increase cadence.

Ultimately though, the cadence data is there to support your running; not be an end goal. Every step you take on a run is a combination of stride length which involves ground contact time, air time, vertical displacement among other things. All these variables interact. Changing one will affect others.

Elite runners run how they feel comfortable. Sometimes it is a high cadence, sometimes it is a low one. Some like Mo Farah have a long stride with low cadence, others like Tirunesh Dibaba are getting their feet to contact the ground as often as possible.

If you enjoyed these articles why not take a look at the ones I wrote about Stride Length – part 1 and part 2.

The Truth About Cadence Part 4

In the Introduction I detailed how, in his Running Formula book, Jack Daniels states that his survey of runners at the 1984 LA Olympics found everyone in events over 3000m had a cadence of 180 or greater – with one exception.

In this post, I’m looking at the 10000m and marathon races from the 2017 World Championships and finding more anomalies than Jack discovered. To read about the cadences of Sprinters and Middle-Distance runners – click the links.

Men’s 10,000m

The race was won by Great Britain’s Mo Farah in 26:49.51s with Uganda’s Joshua Cheptegui and Kenya’s Paul Tanui finishing less than a second behind him. Twenty-two runners had started the 25-lap race and while the early going was slow the race eventually settled down to running laps at around 4:15-30/mile pace. Gradually runners were dropped from the lead pack and at the bell Farah was leading a group of six;  it was here that he kicked and covered the final lap in under 56 seconds.

The technical report on the race covers the first eight finishers and provides their data in the home straight on the 15th lap. We are given the Step Rate when the race has settled down and the runners are running at around 4:30/mile.

Table 1 – Step Rate (Hz) and Cadence (SPM) data for top 8 finishers in Men’s 10,000m

I’ve done the conversion from Step Rate to cadence and we can see there is a huge range from 171 up to 206spm. Mo Farah is just a couple of steps higher at 173 than Canada’s Mohammed Ahmed (171). It’s clear a sub-180 cadence was no hindrance to Farah because he won the gold and Ahmed finished 8th in 27min02 only fifteen seconds behind.

Many of the athletes are running at Jack Daniels’ predicted 180 cadence with Kenya’s Jemal Yimer (194) and Ethiopia’s Bedan Muchiri (206) being the notable exceptions. While the focus of these posts has been to ignore stride length; I think it is useful to recognise Muchiri’s is 1.75m here.

The technical report also provides greater detail (table 2) for the three medallists with their cadence from five points in the race including the home straight as they battle for gold at top speed.

Table 2 – Step Rate (Hz) and Cadence (SPM) data for Men’s 10,000m medallists

What we see is that, for much of the race, Mo Farah is operating at sub-180 cadence while Cheptegui and Tanui are operating at 180-190. It’s when they reach the final lap of the race that they put the afterburners on and here we see all three runners increase their cadence. Mo Farah continues to have the lowest of the three albeit he is achieving a cadence of 200 at this point.

Women’s 10,000m

The women’s race was run differently to the men’s 10000m. While initially both races began slowly with a pack of runners bunched together; it was about twelve minutes into the women’s race on the 9th lap that eventual winner Almaz Ayana took charge.

While the 8th lap had been completed in 1:15 (5min/mile) she now moved to the front and upped the pace with the next two laps coming in 1:08 and 1:07 (4:35-40/mile). Gradually she pulled away from the the rest of the field, lapping back markers and went on to win gold finishing almost a minute ahead of the other medallists. There was a tussle between Tirunesh Dibaba (silver) and Agnes Tirop (bronze) over the last lap with Alice Nanowuna following in fifty metres behind them.

The cadence data (table 3) is a little more conventional for the women with all the runners between 180-192 yet there is one exception – Kenya’s Alice Nawowuna who is down at 173. The race commentators mention Nawowuna is the tallest of the three Kenyans which could explain a longer stride.

Table 3 – Step Rate (Hz) and Cadence (SPM) data for top 8 finishers in Women’s 10,000m

As with the men’s data, the sample is from midrace approaching 6000m where they are running at about 4:50-55/mile with the exception of leader Ayana who is at 4:35 and Molly Huddle at 5:03.

Below in table 4 we see the race breakdown for the medallists and cadence increases in the final lap on the home straight. Ayana is unchallenged so never has to hit her highest gear. The battle between Dibaba and Tirop is close and we can see their cadences are very different. At this stage of her career, Dibaba had been running marathons for three years and it is notable how smooth her stride is sprinting against Tirop. At 228, Dibaba’s turnover in this finishing straight is as good as, or better, than many middle distance runners while throughout the rest of the race she is above average by hitting the low 190s.

Table 4 – Step Rate (Hz) and Cadence (SPM) data for Women’s 10,000m medallists

Marathon

The 2017 World Championship marathons were held on a four lap street circuit around London with each lap measuring about 10km.  While there were some long straights on the course, it also had a number of corners to be negotiated which either required runners to run wider or adapt their pace. It was a true head-to-head race in the sense of trying to beat other runners rather than going for a time.

The marathon data is possibly the most interesting data in this whole study because we have two sets of data for the men recorded at around 30km and 40km and, with runners tiring in both men’s and women’s races, we get a glimpse of them running at paces we might expect from above average recreational runners.

The men’s race was won by Geoffrey Kirui of Ethiopia in 2:08:27. Table 5 shows his cadence on lap 3 is 191spm where he is recorded running at 4:50/mile. Having taken the lead at 35km and opened up a lead over silver medallist Tamirat Tola, he had slowed by the 40km mark. By this point he was running at 5:25/mile and his cadence had dropped to 186spm.

Table 5 – Men’s marathon data at roughly 30 and 40km

Of the other six runners who data was recorded for, only Callum Hawkins increased his pace in the last 10km – this was consistent with him moving up in the race from 8th place to finish 4th. To run 10secs/mile quicker his cadence increased from 187 to 194.

Meanwhile Tola, who slowed by almost a minute per mile, dropped his cadence from 183 to 180; similarly Wanjiru who slowed to over 6mins/mile had his cadence drop from 192 to 185.  The other three runners see a small drop in pace – Simbu slows by 5secs/mile – a relatively low cadence of 175 drops further to 173; Kipketer’s cadence remains the same as he slows by 13secs/mile and the one anomaly is Ghebregergis who fractionally increases Step Rate while slowing by 12secs/mile. I’d be inclined to see this as remaining the same with the 0.01Hz change attributable to the normal variations which occur while running.


The women’s marathon was won by Rose Chelimo in 2:27:11 – not a particularly fast time by modern standards – equating to an average pace of 5:37/mile (35min per 10K). But it was closely contested with the top four runners finishing within ten seconds of each other.

Unlike the men’s race, there is only data provided from the 4th lap – the 40km mark – and at this late stage of the race we see in table 6 a variety of paces from the 5:28/mile of USA’s Amy Cragg who is almost a minute per mile quicker than Kirwa and Dibaba at 6:17 (barely quicker then a 20min 5K parkrun).

Table 6 – Women’s marathon data at roughly 40km

We see a significant range of cadences despite all eight finishers running 2hr27-28. Gold and bronze medallists, Chelimo and Cragg are hitting the 190s with Kiplagat, Daniel and Kirwa in the mid-180s – all in line with Jack Daniels’ findings.

Yet there are three runners with sub-180 cadences. There are Ethiopia’s Shure Demise and Mare Dibaba (unrelated to Tirunesh) in the mid-170s. And then there is Kenya’s Helah Kiprop running at only 165spm. Finishing seventh, a minute behind Chelimo this was far from her best race which was a Marathon Majors win in Tokyo in a time of 2:21:27. Knowing she can run a marathon around 20secs per mile faster opens up the question of whether she would achieve that pace through a quicker cadence, longer stride rate or a combination of the two. I would expect her to be capable of a quicker cadence as 165 is extremely low compared to all the other runners detailed.


Collating the data into table 7 for all 32 runners across the four races we see a symmetrical range of cadences where the majority are in the 180s – which aligns with the average cadence data being 183-185spm. But it also highlights that over a quarter of these runners can be running at sub-180 cadences.

Table 7 – number of runners for each cadence grouping

While the variety of paces goes from 4:15/mile in the men’s 10,000m down to 6:15+/mile in the women’s marathon – we should remember these are all world class athletes who are training many hours per week and getting excellent coaching. They are running times many of us will only dream of and among these runners having a sub-180 cadence is not holding them back.

We’ve also glimpsed cadence at slower paces – the marathons have three men running at 5:49, 5:51, 6:10 per mile and four women running at 5:56, 5:58, 6:17, 6:17 – these are the paces for a 18-20min 5K.  The cadences for these seven runners are 179, 180, 185 and 177, 165, 175, 186.

This suggests, but is by no means definite that, as elite runners move towards recreational paces their cadence can be lower than 180. It’s also backed up by how when the men slowed in their race, four of six runners had lower cadences, while Callum Hawkins increased his pace by increasing his cadence as did each of the 10000m medallists.

In the final post in this series I will summarise what the cadence data can tell us about running and what it might mean for you as a recreational runner. Click here to go to it.

The Truth About Cadence Part 3

Having looked at sprinters, our attention now turns to the middle distance runners. Traditionally competing in the 800, 1500 and perhaps the 3,000m; the research hit a problem – World Athletics didn’t report on any of these races at the 2017 World Championships. Fortunately, as I was writing this series of posts, the 2024 European Championships in Rome were taking place and so, I had to be like Jack Daniels, and do my own bit of counting. Using the televised footage I was able to replay certain sequences of the races to get an idea of the cadences involved.

I watched each race through in its entirety to get an understanding of how it played out and identify which runners were near the front of the pack and of whom I could get an unobstructed view. Often the TV director regularly switched between close-ups and long shots of the race, on different runners and by necessity switching to different cameras positioned around the track. Typically I managed to count the paces for 15-20secs and then multiplied that up to get a value per minute. Being manually calculated in this way, I could be out by a few steps per minute but we’re interested in getting a rough idea of the numbers involved – not doing an exact scientific breakdown!

Having identified one runner for each race I then did a lap-by-lap breakdown for them. This was necessary because longer races can start off slowly, building the pace and then finishing in a mad dash to the line. We might expect different cadences as the race pace picks up or lulls. With only one runner analysed per race it’s by no means a perfect look at the cadences we see but it’s an indication.

800m

The men’s final was won by France’s Gabriel Tual in 1:44.87 and it was his data I collected for the two lap race. The first lap took 53sec which is around 3:30/mile and his cadence was 197spm.

The 2nd lap was marginally quicker at 52sec but in the home straight Tual put in a big sprint finish and this was what I measured. I watched and rewatched the video multiple times as my first calculation had him registering a cadence of 234spm, a second viewing it was 224 and I finally settled at 228spm. This is a significantly higher value than the rest of his race but what we expect when runners sprint.


For the women’s 800m, I used Great Britain’s Keely Hodgkinson as my subject. She’s run the fastest time in the world this year and is in with a chance of winning gold at the Paris Olympics. She actually won the gold at these championships, but I recorded her cadence in the semi-final where she ran 1:58.08.

The first lap of the race was run in 57.6s followed by a slightly slower second lap of 60.4sec. The cadence for the first lap was 202spm, rising to 206spm on the second. This might seem strange given the second lap was slower but from 400-600m the runners slowed before Keely accelerated away on the final bend where I measured her second lap cadence.

What we can see from both the men’s and women’s race is it’s not unusual for 800m runners to have cadences of over 200 during the main race. And with speed being a key requisite for its runners, it’s no surprise to see that a runner like Tual has the ability to hit even higher cadences.

1,500m

Norway’s Jakob Ingebrigtsen is arguably the star of male middle distance track racing at the moment. It was his data (table 1) I captured during the heats of the men’s 1,500m event. Due to the race being a 300m lap followed by three full 400m circuits, it is difficult to know where to place the short ‘lap’ when trying to ascertain split times.

Table 1 – data for three medallists nearing the finish line

Being a heat, it was an easy race for Jakob and he seemingly jogged off the start line such that everyone was ten metres ahead of him. From there he sat at the back of the pack avoiding trouble until the final 300m when he overtook everyone and finished first. We can see his cadence is steady around the 186-194 mark while he was at the back and then when he accelerated it went over 200.

The women’s final where I obtained the cadence data was run even more tactically with the first two laps at a relatively sedate pace before it began to wind up and Ireland’s Ciara Mageean came through to take the gold. Even though the pace was a little slower we see that the cadences were all lower throughout.

Table 2 – Ciara Mageean’s cadence at 1,500m

So that’s cadence for middle distance runners. Bear in mind, the data provided here is limited to four individuals – Gabriel Tual, Keely Hodgkinson, Jakob Ingebritsen and Ciara Mageean. There’s strong reason to believe its representative for all elite runners but there will be some individual variance with others.

If this data shows us anything in particular it’s that the faster you run – the higher your cadence. Intuitively that makes sense. We see the “magic 180” figure is being adhered to at paces around 4:30/mile and when middle distance runners break into a sprint they go over 200spm but never approach the cadence of the short sprints.

In the next post – we will look at the cadence of long distance runners. Most recreational runners only compete in these types of races so it should provide interesting data. Click here to go to it.

The Truth About Cadence Part 2

In the introduction to this series I wrote about how running coach Jack Daniels spent the 1984 LA Olympics measuring the cadence of runners, but what he didn’t measure was the cadence of elite sprinters. This may simply have been because, as a distance running coach, he wasn’t interested by sprinters; or it may be because sprinters are significantly quicker making counting harder.


Fortunately World Athletics produced a series of reports from the 2017 World Championships giving us the data for sprinters as well as distance runners. Through the use of digital technology the research is very accurate. Using cameras capable of capturing up to 250 frames per second, runners were recorded in the middle of the home straight and then again in the 10 metres before the finish line.

At this point, we need to recognise that sprinters don’t work in cadence (number of steps in a minute) probably because their races are over in seconds. They refer to frequency or Step Rate (Hz) – how many steps they take per second!  Still to try and make it meaningful for this article, I’ve calculated the equivalent cadence – multiplying by sixty and rounding off – to get a value for a minute.

100m

Table 1 below shows the step rate and calculated cadence for the men’s 100m with competitors ordered by their finish place. Justin Gatlin took gold in 9.92secs, Christian Coleman silver in 9.94s and Usain Bolt took bronze in 9.95s – just 0.03seconds separating them.

The cadences were sampled during the mid-section of the race when athletes are accelerating and their cadences will still be high. We can see, with the exception of Bolt, that the cadences range from 278 (Prescod) to 300 (Simbine and Su). These are typical elite men’s values.  Usain Bolt’s turnover is notably lower at 263 which is probably because he is tall (6’5” / 1.95m) and that makes it harder to recover the legs quickly. This obviously didn’t stop him having a successful career as his height gives him a longer stride.

Table 1 – Men’s 100m final data at around halfway

In any sprint the cadence is highest at the beginning where athletes take small, quick steps to accelerate. As the race goes on they begin to rely on stride length (which is why Bolt excels in the later stages of both the 100m and 200m) and the cadence drops partly due to spending longer in the air – ‘longer’ is measured in hundredths of a second though.

Table 2 details only the medallists in the final 10metres of the race we can see the Step Rate / Cadence has dropped albeit it is still notably high. In such a tight race we can be sure all three sprinters are giving their best effort and therefore these values are representative. There’s roughly a 10% drop-off from earlier in the race.

Table 2 – data for three medallists nearing the finish line

These sprint values are matched by women sprinters as you will see in table 3 below. Perhaps their values are a little lower overall but we can see from Baptiste and Ahouré that women are capable of the highest cadences. Just as the men use no one set cadence (or step frequency) throughout – it changes and adapts as the race goes on – the three female medallists do too.

Likewise, as Bolt showed how height affects cadence, we see Schippers at 5.9” (1.79m) has a slightly lower cadence than the others in the field at 275. Approaching the line there is a slight increase in her cadence, which is probably a negligible difference, and which probably reflects two World Championship golds won in the 200m and would have involved training speed endurance for a longer race.

Table 3 – Women’s 100m final at halfway plus medallists nearing the finish

400m

In running one lap of the track as fast as possible, a world class 400m runner completes the distance in around 45 seconds if they’re male, 50s if they’re female.  It is an event where anaerobic energy plays a large part in creating the speed but where the build-up of ‘lactic acid’ causes the legs to start seizing up – particularly in the home straight. (It’s not really lactic acid but that’s the conventional wisdom).

The data presented in table 4 from the men’s 2017 World Championship final is taken at 350m – so the legs will be starting to struggle. Again runners are listed in their finishing order.

Table 4 – Men’s 400m cadences in the home straight

And here in table 5 is the data for the women’s race.

Table 5 – Women’s 400m cadences in the home straight

With these values occurring in the home straight where the commentators say “the bear jumps on your back” due to the lactic build-up making the limbs feel heavy; we aren’t necessarily getting the entire picture of the cadences which 400m runners are capable of achieving.

Fortunately there is data available here detailing the cadences in the four quarters of the 2016 Rio Olympic final where Wayde van Niekerk set the world record running against two of his main rivals Kirani James and LaShawn Merrit; as well as the data from Michael Johnson’s previous world record run in 1999. While it appears these are manually counted by the blogger, the numbers are very close to those presented in the 2017 WC report for van Niekerk; a report which also contains data for Butch Reynolds who set the previous world record. This is all detailed in table 6.

Table 6 – comparison of elite 400m runners Step Rate and Cadence across whole race

What’s notable is the variance across the runners.  You go from Butch Reynolds who is consistently around 220 for the whole race up to Michael Johnson who is consistently around 250. In between the other runners all start off with a high cadence which is dropping off by the final 100m.


What we can say for sure is the longer sprint distance of 400m results in lower cadences than those in the 100m. Johnson has the highest cadence of anyone here at 259 in the first 100m and that’s below the 100m runners who, with the exception of Bolt, were in the 280-300 range.

This isn’t surprising as 400m runners tend to be taller than 100m runners, usually over 6’ / 1.85m taking long strides to cover the ground quickly which combines with a lower cadence.  It’s not always the case – Michael Johnson has the highest cadence yet is slightly taller than van Niekerk.  They may also have lower cadences or shorter strides because they are running slower – the male 400m runners are averaging just under 11 seconds per 100m.

I’ve deliberately not included stride lengths in this piece because it’s here to give an idea of cadences across events. But what Johnson and Reynolds show is how there is no one specific cadence or stride length being used to get them to a world record – each adopted what worked for them.

In the next article, it’s time to look at the middle distance runnersclick here to go to it.

The Truth About Cadence Part 1

Is taking 180 steps per minute the magic number to aim for? Just about every search you do on the web will tell you it is. I’m not entirely sure though. As you will see almost all elites do indeed run with a cadence of 180+. But they’re elites and they’re typically only measured running at elite paces i.e. 5min / mile or better.

If you’ve arrived here by Google (or any other search engine of your choice) then you probably already know what cadence is.  If you didn’t – it relates to how many steps you’re taking per minute – your step rate, sometimes inaccurately referred to as stride rate. The two tend to be used interchangeably. Maybe that’s why it’s easier to refer to it as running cadence!

Your running cadence is likely to be somewhere between 160-200; although at one stage mine was as low as 150. It’s also possible for it to be a little higher than 200. If you’re walking it will be significantly lower – something like 100-120. All of it, as we shall see, depends on how fast you’re moving.

In the days when information was less accessible and sport science was still evolving; I recall reading that running speed is simply the result of how many steps you take in a minute and how far you travel with each step. This was made to sound mathematical by saying Running Speed = Step Frequency x Step Length.  If you take 200 steps in a minute and cover 1 metre with each then you run 200m in a minute therefore with 1,609 metres in a mile you’re running at 8min/mile.

I previously tackled Stride Length in a couple of articles written some time ago because I feel that’s more important for recreational runners to work on. But having written articles on how the glutes should power runners and how it’s possible to create high cadence by not using the glutes I wanted to dig further into the topic.

Origins of 180

In his Running Formula book, renowned coach Jack Daniels states that he and his wife spent the LA Olympics in 1984 counting the cadence of elite athletes. Rather than count the steps, they counted armswings because they’re always in sync – as a leg moves forward, an arm moves forward. It’s a good way of counting cadence which I use when I’m evaluating runners.

Jack found that 800m runners had the highest cadences of over 200 with other middle distance runners approaching this value. Once he turned to the runners in races longer than 3000m he found the cadence was lower; yet all but one runner had a cadence of 180 or more.

While I cannot state for certain this is where the magic 180 number came from, I think it’s quite likely. During those Olympics he counted 50 runners – male and female and therefore got a good sampling. These days we are lucky enough to have cadence monitoring built in to our GPS or smartwatches and if we want to look at elite runners we can watch playbacks on digital film or video.


In this series of posts, I’m going to provide you with the cadence data for contemporary runners. Some of it has been calculated with the latest digital cameras and film; others I’ve used Jack’s method of counting armswings! I’ll be looking at sprinters and middle distance runners as well as those doing the longer events like 10,000m and marathon that many recreational runners race too.

To read part 2 and find out the cadence of elite sprinters – click here.

Update on my 800m training – Apr 2023

April has been a quiet month. Entering it I had high hopes of recording a decent time at Bournemouth Bay 1/2M but those were trashed when I ran three minutes slower than last year. I tapered better this year and my legs felt fresher on the day but, come the run it was a gradual slide with the first 2-3 miles coming in at just under seven minute miles. From mile five onwards the pace dropped to 7:25 and worse. I just had nothing and have easily done better runs in training. I documented last month how I ran six miles in 42-mins in training.

What was strange was how low my heart-rate was throughout the run. It ended up averaging 149bpm which when I consider I do Steady runs in the low 150s was very out of place. What it does go to prove is how little use a heart-rate monitor can be.

I took five days off after the half (no running at all) then went to Poole parkrun and ran 20:57. Both my calves and glutes were sore from it and I had a very slow, dreary Sunday 10-mile run. I ran thirty minutes each day through the following week and returned to Poole parkrun knocking my time down to 20:39. The following week was the same routine, a slightly faster but still drudgy ten mile run then thirty minutes each day. This resulted in a 20:17 parkrun! Three weeks of easy running, no speedwork and my racing simply got faster by forty seconds.

It now seems clear that I’d fatigued my legs too much in training. When I look back I’ve been doing fifty mile weeks since last summer and training hard in the week. The heart-rate monitor numbers were correct but the monitor itself can’t tell you how fatigued you are.


My overall feeling though is one of disillusionment – I’m simply not cut out for distance running. When I compare my training to others, I simply don’t get the results from training that they achieve off much less. I train hard with all sorts of different sessions but ultimately I’m physically not cut out for long distances.

I’ve known this for a while, it’s why I started training for the 800m. Thus far I haven’t really worked on developing my speed to a high level because I’ve been trying to keep the aerobic side in balance. As I’ve written in the Ageing series, the best male sprinters of my age are running under 11 seconds for 100m, 22s for 200m and 50s for 400m. While I’ve not gone all-out at any of these I’d be surprised if I could crack 14s for 100m, 30s for 200m or 1min15 for 400m – that’s just too far down and a gap I need to close up. It’s not because I’m not capable, it’s because I haven’t trained for it in years.

I’m beginning to conclude this has been where I’m going wrong. The first two iterations of training I followed JackD’s plan as he is a proven coach. It didn’t really help me. Last year I began hill training using a progression from Steve Magness’ The Science of Running and I felt this made a difference despite only doing one weekly session for three months.

I’m torn between entirely given up on the distance work until I’m notably nearer to the age-group records or trying to keep the two things in balance. All I know is when I started running seriously a decade ago, I was probably quicker on the speed side. I have little objective proof of this but my legs were much bigger and stronger. I was quickly able to build some of my best times at parkrun, 10K and half marathon on lower mileage than I’ve been doing recently because I had the speed first.


This summer’s plan is to repeat what I did last April / May / June. I combined Steve Magness’ hill sprints on a Monday with Jack Daniels’ 800m training plan on Wednesdays and Fridays. I lasted about nine weeks before I could see I’d peaked and my aerobic fitness was declining.

This year I’m intending to do the same but with some changes. Where I previously followed Jack’s plan for runners covering 30-40mpw, this year I’m downgrading to the 20-30mpw plan with shorter recovery and long runs. Actually Jack’s long run has always lasted only about an hour on these plans but I always did something in the 1hr30-40 range in an attempt to keep my aerobic system up.

The other change I’m going to make, as I’m not doing a time trial prior to starting training, is to be conservative on my numbers. I’m based my training level on my half marathon and fastest parkrun which basically have me running at the level of a 2:36 800m runner. It’s not that fast but I’m aiming to keep my legs fresher this year through less intensity and lower volume of training. Again this 2:36 start point is why I don’t think I’ve got the speedside sorted. It really isn’t that fast given how in shape and athletic I am. I just haven’t trained for speed enough in years.


I resumed faster training in the final week of April. I did 6x8sec hill sprints on Monday which felt great and I loved despite blowing hard at the end of each effort. On Wednesday I did 6x200m with 200m jog recovery aiming for 43s, they avg’ed 40.4sec. On Friday my legs were perking up and I repeated the session, this time with eight efforts, and they avg’ed 39.6sec. My body felt like it was hitting new territory. Or at least territory which it hasn’t been to in a long time. My breathing was gasping in the final efforts. I’ve been there before but this felt different for some inexplicable reason.

Before each of the workouts, I’ve been doing drills and strides to help warm-up and ingrain good form. I began these eighteen months ago and change has been gradual, notably beginning to kick in at the start of the year when I was doing my last block of short intervals. This explains why my glutes and calves hurt after the half marathon. It was the longest sustained effort I’ve done using that running form and therefore being powered by those muscles. My stride seems to be lengthening and when I begin an effort I can hit higher cadences than usual. This all suggests I can get quicker and build my speed up to the levels I desire.

The Beauty of VDOT

Jack Daniels is a famous running coach with an infamous moniker. Mention him to anyone outside the world of running (as well as quite often within it) and you get a remark about drinking whisky. He has been called “the world’s best running coach” by Runner’s World and has coaching experience dating back to the 1960s. He himself won medals in the modern pentathlon at the Melbourne and Rome Olympics. If you’ve been following my blog, you’ll know I used his 800m training plan last year for my training.

He took a scientific approach by examining the relationship between how fast runners race and the big three measurables: V̇O2max (properly stated as “V-dot-O2max”), Lactate Threshold and Running Economy. Historically it was believed the runners who could process the most oxygen (V̇O2max) were the fastest. But when Jack compared himself to Jimmy Gilbert, a teammate with a significantly higher score, it didn’t make sense because Jack could often beat him in their 4,000m pentathlon races.

Realising the picture was incomplete Jack and Jimmy began measuring elite runners and from this were able to publish tables of data relating race times to training paces. Online calculators doing this are more commonplace now but even twenty years ago this was revolutionary.

My 2nd and 3rd editions

The 4th edition of Jack’s book Daniels’ Running Formula was published in 2021 but I have yet to lay eyes on it. I bought a copy of the 2nd edition ten years ago and it revamped my ideas about how to train. It laid out step by step how you create your own training plan, what paces to run at and so on. It’s packed with information, pictures and profiles of elite runners and all laid out in a highly readable font and format. By comparison the 3rd edition seems to be full of standard plans rather than teaching you how to coach yourself and I think this likely reflects the increased participation and how much less modern people like to think for themselves.

In each book it’s the VDOT tables which I prize most. There’s two obvious uses, firstly the tables provide the times you should be able to run for different race distances for your current ability. Secondly they tell you what pace to train at to make progress to the next level.

VDOT training paces in the 2nd edition – pages falling out through heavy use

If you run parkrun in 25-minutes then the book suggests running Easy runs at 10:35/mile (which is a lot slower than most people realise). To run marathon pace at 9:08/mile and to run fast intervals at 54-secs / 200m (again this would seem slow to most).

The race times converter suggests to be able to run a 3hr marathon you need to be able to run a 1hr25 half, 39-min 10K and 18:45 5K. In the old days, people estimated that a doubling of distance resulted in a time that was double plus 5-10% (which agrees with these) but they had to work it out every time.

The benefit of knowing race times is huge. Most runners either go out tentatively and therefore can never hit their best possible time; or go out hard and blow up. For example, If you have run a 25-minute 5K then you’ll be able to scrape in for a four hour marathon with good training. But while the average pace of a 25-min 5K runner is about 8 min / mile their marathon pace is 9 min / mile at best. They can go out and practice this pace in training to get used to what it feels like.

The Real Prize

The VDOT tables aren’t perfect and when you’re trained more towards speed or endurance, they can push you down the wrong path a little. That’s not to say they’re terrible, they’re not and a good general guide to follow.

The tables stretch from VDOT 30 all the way up to the elite standard of VDOT 85 which line up with the men’s world records. When you consider the average parkrun time is 28:57 (a VDOT of 32) then it suggests there is much untapped potential among runners. This VDOT is close to the bottom of Jack’s table and while not everybody is genetically capable or motivated enough to train, this begins to suggest why there is something of an obesity and health crisis these days.

Even times which are considered quite exceptional by average runners e.g. 20-min parkrun (VDOT 51), 45-min 10K (VDOT 45), 1hr45 half marathon (VDOT 40) and sub-4 marathon (VDOT 38) are actually much closer to those of a beginner than they are to the elites.

It’s not just the context I prize, I can see how quickly progress may or may not be made. Let’s say I start coaching someone who runs parkrun in 25-minutes. To get them under 23-mins – which sounds massive to them – requires four levels of progress. Yet for a 17-min parkrunner the same four levels of progress won’t even get them under sixteen. Of course we intuitively know progress is smaller at the faster levels but it’s good to have it quantified and be able to manage expectations.

Although Jack doesn’t say it, I believe you might expect to see a VDOT improvement of one level every six weeks, two per quarter and eight per year. This is probably a little optimistic and depends on commitment to training but again highlights why it may take the better part of a decade to reach your peak:

YearStarting VDOTparkrunEasy pace per mile/km
13030:4012:407:52
23825:1210:356:52
34621:259:075:52
45419:178:014:59
56217:037:114:35
67014:556:304:02
77813:355:57/mile3:42

While the VDOT numbers and paces are accurate, the rate of progress is an example. Experienced or talented runners would start higher up the scale; and how quickly anyone develops depends on how training is structured. Nonetheless, I find the VDOT tables extremely useful for gauging what we could hope to achieve over the coming year, as well as a reminder of where I might get to with repeated years of building on past training.

As I said before, I picked up Jack’s book ten years ago and it still sits on my coffee table. While it’s not the typical read for a coffee table book, I doubt a week has gone by in that decade when I haven’t picked it up and looked at the VDOT tables.

Update on my 800m training – May 2021

In April’s update I talked about the surprise of seeing no improvement in my 800m time despite seeing myself get fitter, faster and leaner over the course of training. After the time trials, I slipped into a six week block of endurance training taking me through to the end of May.

At the height of training back in January and February my weekly mileages were in the 40-45 range. As the April time trials approached I eased off to let the legs freshen up and recorded a couple of weeks in the high thirties. With the return of endurance training and the bigger runs midweek, the totals for the six week totals were 49, 49, 50, 52, 47, 48.  May alone comes in at 220 miles.

My schedule for this block of endurance was:

  • Monday – 40min recovery run
  • Tuesday – 8-mile Steady run (with warm-up / cooldown)
  • Wednesday – 40min recovery run
  • Thursday – 40min recovery run
  • Friday – 8-mile Steady run (with warm-up / cooldown)
  • Saturday – 40min recovery run
  • Sunday – 11.7-mile fasted Long run

I adapted it once or twice, threw in some strides occasionally but always two Steady runs in the week with a Long run at similar effort level on a Sunday. Recovery runs on all the other days.

Steady improvement

Across the six week I did twelve Steady runs. May was unseasonably poor weather so the conditions varied from complete calm to 20mph winds. All but one was done at the beach where the wind doesn’t always blow in the same direction. I have a 9-mile out and back route from Durley Chine to near the end of the prom at Hengistbury Head. I always just allow the runs to get faster but the first half mile is taken carefully and I discount the split for this, then run four miles out, four miles back and run the last half mile back as a warmdown. This eight-mile exertion takes a little over an hour which is perfect.

Here’s a table of those eight mile runs at the beach. For ease of reading I’ve ordered the miles from fastest to slowest for each run as it allows you to see how the quickest are getting faster.

20-Apr23-Apr27-Apr30-Apr04-May07-May11-May14-May18-May20-May25-May28-May
108:1007:5507:2907:4407:3707:1107:4507:2307:0607:0807:0907:31
208:1507:5907:3607:5107:4407:1807:4907:2407:1007:1807:1107:35
308:3108:0007:3707:5207:4607:2607:4907:2607:2207:2107:2807:45
408:4208:0907:4508:0108:0107:3307:5207:3507:3007:3907:3107:53
508:5508:3307:5008:0309:0907:4707:5507:3808:0407:4808:2807:58
608:5608:3907:5508:0309:1508:0708:1707:4808:2007:5508:3308:00
709:0208:5407:5908:0609:2908:1508:2007:4808:2007:5708:3808:01
809:0508:5708:0308:0709:3008:1608:2107:5308:3108:0008:4208:03
             
Avg08:4208:2307:4707:5808:3407:4408:0107:3707:4807:3807:5807:51

You can see in the first week I couldn’t even break 8-min mile pace on these runs whereas by the final week, every mile was faster. If you track across the fourth mile row, you can see it was beginning to consistently be around the 7:30 mark a solid improvement from the early weeks. The final run was a backslide but I suspect the legs were tired from the excellent 7:38/mile paced Sunday long run preceding them.

This table also highlights how improvement isn’t a linear thing. It can be two steps forward, one step back while you recover and consolidate but if you can stay injury-free there should be an improvement over time. Some of the ups and downs in the table are due to windy days!

Changing run form

In April, I began thinking about my form again. I’ve probably been looking at aspects of my form since 2013 when I bought a cadence monitor and started improving that. It’s a real work in progress and last year when I was doing hill sprints and bounding I began to feel some sense of how to get quicker. In the summer when I strengthened up my core I found it made a difference to my running but I still feel there’s been something missing from my sprint speed.

I reread some of my books which talk about technique and watched some Youtube videos of sprinters and how it is something of a difference action to how most distance runners run. I found some drills and exercises that began to improve my knee lift and instantly I could feel more drive when my feet hit the ground. At my coaching sessions, I do these drills as part of the warm-up to try and help the runners to improve.

Over the course of this training block, I’ve slowly been integrating this new knee drive action into my running and when it’s going well I feel like I’m running on air. My upper body seems to become almost still (other than armswing) and my lower body begins to feel like it’s doing all the work. It feels like I’m running from the hips and every step is driving me forward. My cadence is slightly up and I’ve even begun to notice quieter footfalls at times.

I still haven’t seen this translates to increased speed in my sprints as I haven’t done many strides but I think it may be responsible for the increased pace on my steady and long runs. I’m looking forward to when I get back to the speedier portions of 800 training as I’ll be hopefully be able to further ingrain this new action.

One small downside is that the outsides of my shoulders have ached towards the end of runs. I think this is because as my armswing is becoming freer and driven by running it’s causing muscles that haven’t previously been used to get involved.

Another time trial

Coming off the six week block of endurance I knew I’d speeded up on my easy runs and hoped it would transfer to my 800 time. It didn’t. At the start of June I did another time trial this time clocking 2:53 – so overall five seconds quicker than in December.

It’s possible that my legs weren’t ready for this recent time trial. The final week of the endurance training saw the paces pick up noticeably and this can sometimes lead to what I call a VO2max lull; a 10-14 day period where the body is adapting and takes a step back.

Truth be told I’m somewhat frustrated by the lack of significant progress in the 800 time, especially as I feel fitter and faster but also because I’ve been quicker following my own methods in the past.

I’m going to stick with JackD’s plan for a second go around and throw in the strides he suggests doing to see if this improves my top-end speed. I suspect there’s a missing link waiting to be filled in that will connect my general endurance to my speed and ability. Let’s see what happens.

Update on my 800m training – March 2021

Things are coming together at last. I’m in the final two weeks of the plan and tapering towards a couple of 800m time trials in April to see whether the training has paid off. I already know it has and it’ll be good to see it quantified in my time trial, but that’s for next month’s update!!

Although I began following Jack Daniels’ 800m training plan at the start of December, I actually consider training started back on 21st September when I went back to a steady diet of gentle runs at ten minute mile pace, subsequently introducing strides and a faster session midweek.

So really this has been six months of consistent training. I wanted to write “hard work” but apart from putting in big efforts during the twice weekly workouts, and a difficult spell around the start of February when my body was struggling to adapt, compounded by atrocious weather, I don’t believe it’s been hard work. I’ve looked forward to the training, enjoyed it and it’s not felt like a burden at all.

I realised over this past month my body has begun to feel fit and strong again. I hadn’t appreciated a lack of regular fast running over the past 3-4 years has allowed muscles to weaken. That translated in my day-to-day living as minor aches or pains walking up the stairs, or pushing with my hands to get up off the sofa. Nothing drastic, just minor little things that most people put down to the effects of ageing. In some ways they are the effects of ageing but not irreversibly as those people would have you believe. The takeaway is if you stop using it, you lose it. I actually now feel as strong and fit as I did ten years ago, and would like to believe I’m as fit as I was in my twenties although I know that’s not quantifiably true. My running still isn’t as fast it was when I started parkrunning at forty but I can see it’s getting back there and I believe it’s going to surpass that because of what I’ve learned since then.


March’s training has been focusing on what Jack calls T- and FR- pace running which stand for Tempo and Fast Rep. After adjusting for the expected improvement in fitness, these have been mile repeats at 7:12/mile and short intervals (200-600m) at 5:38/mile respectively. To put this into perspective when I began in December the Fast Reps were 44½ secs per 200m, now they’re at 42secs. Training has been going well enough that I’ve been overcooking these with some coming in at sub-40! I even managed a 37.45s effort (5:01/mile).

One of the problems I faced for T-paced sessions is ideally needing somewhere flat where I could keep pace and effort consistent. In other years, I would have gone to the beach or Poole Park, but with lockdown ongoing, as well as the possibility of sand on the prom or people out for a walk; I decided to look closer to home. The roads right outside my front door are fairly flat and quiet, but I’ve always resisted doing intervals on them for no explicable reason other than I always think of warm-up as taking me away from home. Circumstances led me to conclude this would be the best place for the training. Maximising the area available to me, I created a loop measuring 900m which had no sharp turns and only minor ups and downs. On some sessions, it meant I ended up doing a good 10+ laps of the same roads which, I suspect many people would find boring, but I hardly noticed as I was focused on my breathing, pace and sometimes trying to reach the end without completely falling apart! This ‘track’ worked well apart from, where I run in the road my early morning sessions brought me into conflict with people driving off to work.

Around mid-month, my legs began to feel strong and, the walking up the stairs with ease I talked about, came into my awareness. I could tell a step change in my fitness was about to come through and when it arrived my easy running pace improved by 20 secs/mile. It felt wonderful and that improvement then fed into the next session of T-pace running coming in at sub-7 min/mile rather than 7:10. In turn it made the fastest intervals feel a lot easier although not necessarily faster!

I’m not going to do my usual breakdown of successful / failed repeats until next month’s post but my attention was drawn to a bizarre set of times on last week’s 200s. I run these back and forth along a road which I’ve come to realise, has slight undulations to it, and these result in one direction being marginally faster than the other. The four efforts in the slower direction were 41.66 / 41.66 / 42.20 / 41.66 secs. I’m sure you can see the bizarreness of the fastest three being exactly the same time to one-hundredth of a second, it simply cannot be a coincidence. And if I then tell you the first effort on the previous session was … yes, you’ve guessed it … 41.66secs; there’s some kind of limitation going on somewhere in all of this! I’m not sure what it is, my legs were fatigued that day but in the other direction I ran 41.77 / 40.05 / 39.33 / 37.45 secs so it was possible to go faster under the right conditions. Bizarre numbers aside, it’s been a good month’s training.


I’ve got two more workouts to do in April, then the time trials begin. I’m only intending to do two mid-month but this will be weather dependent. If I feel I’ve underperformed I may slot in a third. Analysing my training times, I’m hopeful I can break 2min40 but I’ll report back whatever the fruits of my harvest are!