My sprint practice has taken a backseat over the last month because I’ve been feeling some fatigue around the lower core and to the right of my groin. Back in 2012 I strained something in there and I had to stop running for three months; so I’m very wary of that happening again especially as I’m now over a decade older. I have thrown a couple of sessions in but not been able to video them, so no piccies to show!
Nonetheless I’m still training every day and running longer intervals of 400m to a mile but not as all-out sprints. One day I was out on a typical training session and I’d planned to run 10x400m intervals. Somewhere around the 7th or 8th I became aware of how I was applying force. My leg would swing backwards from its high knee, my foot would hit the ground and then I’d stopped putting in effort and coast over the stationary foot. I immediately knew what I was doing wrong.
Last month I wrote about the mental image of how skateboarders paw the ground to push themselves forward. While I was referring to that in terms of sprint technique and, while on these 400s I wasn’t flat out sprinting, I realised I was doing the equivalent of the skateboarder bringing their foot down to the ground and then half-heartedly pushing through. In effect, creating friction and drag rather than adding energy to the stride.
I’ve written previously about hip extension and how elite runners push their foot back using the glutes until the leg is behind them. Yet it was only in this moment that I actually felt myself not doing this. A moment where I gained the awareness that as soon as my foot hit the ground, I let the ground slow me rather than put in effort to push through with the glute and attack back at the tarmac.
A few days later, on an easy jog, I noticed I was deliberately trying not to put in too much effort. My foot barely left the ground and to push all the way through with the glute felt like I was putting in more effort than I wanted for an easy run. It seems this had become a bad habit that had carried through to faster running.
While I haven’t been able to work on my sprinting, I have been able to focus on this during long intervals by being aware that I’m getting full hip extension and driving the leg through forcefully. It doesn’t always happen because tiredness sets in and those muscles aren’t necessarily used to applying effort all the time for longer periods but it does seem to be happening more regularly.
What I’m finding is that I’m naturally staying up on my toes more and and my glutes are beginning to burn. That’s a surefire sign that the correct muscles are firing.
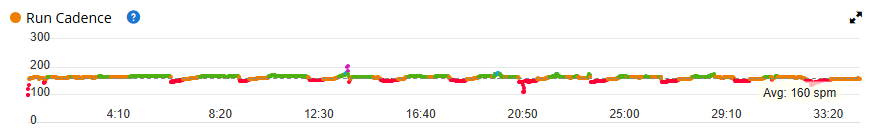
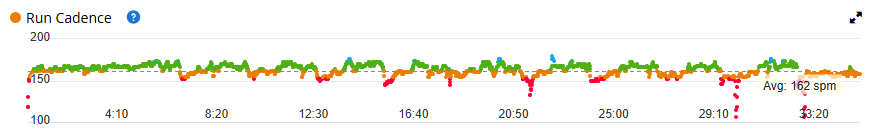
When I arrived home and uploaded my run, I noticed my cadence graph is looking much smoother. There’s a couple of aberrations in there which happens as I navigate corners and slopes but otherwise it looks unusually smooth.
I went back to the start of October and compared it to what the graph looked liked then. Notably less smooth.
Overall I’m sure this is a good sign for my running. I suspect it may be the first time in my life where I’ve run with a mechanically advantageous stride. And lately I’ve noticed my running is getting quieter. I’m skimming over the ground more than pounding into it which is indicated by what the improved cadence smoothness shows.
The previous parts of this series can be accessed by clicking on the following links where they will open in new windows. Part 1, Part 2, Part 3, Part 4.
I wrote this series of posts because there is an idea out there that 180 steps per minute is the perfect number to run at and I want to investigate. Only this past weekend, I came across an interview with Chris McDougall, author of Born to Run, where he stated “For perfect running form you should be running at 90 strides per minute” therefore 180 steps.
The idea that there’s a perfect onesize fits all cadence for people of different heights, weights, speeds and abilities has always seemed wrong to me. Maybe it’s because I’m tall and, when I started running I counted my cadence at 150 steps per minute on easy runs rising to mid-150s when I picked up the pace but hardly ever going over 160 in a race. I always assumed it would increase as I got faster, after all I was rarely running any quicker than 7min/mile. On reflection these lower numbers are partly because my form was poor and I was overstriding yet even today with improved technique I’m still running easy runs in the mid-160s. It might reach 180 at 6min/mile and when I pick up my pace to 5min/mile I start to hit the 190s. When I sprint it rises above 200spm. This is the progression we glimpsed for some of the elites.
To recap, the trend for elite cadence data is that very high cadences are only seen over short distances. As the race distance gets longer, cadence drops until for the majority of runners it reaches 180. That gels with the ‘180-rule’ idea and the drop-off makes sense because the shorter races are run at lower speeds and we know speed is created through a combination of steps and stride length. Sprinters have both high cadences and very long strides – neither of which is sustainable for a distance runner. It is only at the end of a distance race where we see endurance athletes raise their cadence and/or stride length to sprint for the line.
Typically we see the 100m sprinters have cadences in the 280-300 range, 400m runners are 220-260, the middle distance runners at 190-210 and long distance is in the 180-190 range.
It’s very clear that if you want to be a sprinter or middle distance runner it’s going to involve high cadences – well over 200spm. Since writing the post on sprinters, I’ve been reading a book on sprint mechanics which began its research in the the early 1980s and now leads to the fastest sprinters training to create high cadences. But its author is very clear to point out this must not occur at the expense of stride length. An adequate stride length is still required. It points out that when some sprinters have pushed their cadence too high (over 300spm) this has been detrimental to their speed.
Whether or not this increase of cadence, which has worked for sprinters, can validly be transferred to long distance running is debateable. For one thing, if it were transferrable then we might expect to already be seeing numerous elite distance runners with cadences well over 200. Whereas the data I covered found only one long distance runner operating at over 200spm. A reason for this may be because sprinters achieve quicker cadence through use of the hip flexors, a relatively weak muscle group, and therefore distance runners would struggle to maintain high cadences for long periods. Even in the 400m we see the cadence of elite sprinters fatiguing and this is in a race lasting 45-50 seconds.
With most recreational runners being interested in races between 5K and marathon in length, the long distance data is most relevant. Thirty-two runners were detailed – eight men and women in their respective 10,000m and marathon races – and we see a different picture to the one presented by Jack Daniels in his book.
At the 1984 Olympics Daniels recorded only one runner having a cadence below 180, out of the fifty he surveyed. His method was very basic and done with the naked eye but, he has also conducted proper scientific research so while observing from the seats is not perfect; his findings are still worthwhile. Ultimately what’s been important throughout these posts has been to get a rough idea of what runners are doing, not coming up with a perfect number.
By contrast the data used in this series of posts, which is taken from the World Athletics reports, has a high standard of scientific rigour to it. High speed digital cameras filming an area which has been carefully measured and calibrated then using computers to analyse the film. This data showed nine of the distance runners (about 25%) had cadences below 180.
For me, the most interesting of these is seeing Mo Farah’s cadence at 173-178 while running at 4:15-30/mile. He is not just a run of the mill athlete, he won multiple Olympic and World titles, which highlights that while 180 may be something to aim for, it is not a prerequisite for success. While his best time in the marathon (2hr05) is not close to the best of the best; he won the 2018 Chicago marathon which is one of the majors.
Recreational paces
What we aren’t seeing from any of this data is what the elites are doing at typical recreational paces which are often 8min/mile or slower. In the marathon, we have data from the men at both the 30 and 40km marks and we see their cadence dropping as they slowed towards 6min/mile. That would suggest that if they run at even slower paces their cadence will drop further. Perhaps.
The marathon data also has three runners who are slower than 6min/mile which is a pace many decent club runners can achieve. The cadences are 175, 185, 186spm – so there is nothing conclusive there.
Rereading a later edition of Daniels’ Running Formula book he mentions that he treadmilled an Olympic marathon gold medallist for their cadence. At 7min/mile it was 184, at 6min/mile 186 and at 5min/mile had reached 190. This is very much in line with what we see in how the cadences drop off in the men’s marathon data reviewed. Yet it is also very different to what Mo Farah is doing in the 10,000m where he is running significantly faster than with lower cadences.
One reason often given for creating a high cadence is to avoid injury. There is some logic, particularly for marathoners, where a higher cadence means a short stride and less vertical displacement i.e. they don’t go as high in the air and therefore don’t hit the ground with as much force. Their effort is used to go more horizontally. A good example of this is Tirunesh Dibaba in the 10,000m race; where she has a high cadence especially when sprinting in the home straight (228spm) and she must be barely leaving the ground with each step. Some years before this race she had moved up to the marathon and so the lower impact is seen as beneficial when you’re running well over one hundred miles per week.
Final thoughts
Most recreational runners are interested in the distance races – anything from 5K to marathon and maybe beyond. When they go out on easy runs they are doing paces of 8min/mile or slower; some of the decent club runners are closer to 7min/mile.
We have no specific detail on what the elites do at these paces but if your cadence is already in the 180-190 range – when you run faster you will need to increase your stride length to get significantly quicker. It may be possible to increase your cadence towards 200 but the data suggests it won’t go much higher. To improve stride length you are going to have to work on strength and speed making sure you are getting full hip extension.
If your cadence is below 160 at slower paces, it may not be an issue particularly if you are tall or muscular but it may be something to consider looking at. Often the advice about 180 cadence is intended to stop runners from overstriding which can lead to injuries. Certainly if you have recurring injuries then it may be worth looking at video of yourself running in conjunction with considering whether to increase cadence.
Ultimately though, the cadence data is there to support your running; not be an end goal. Every step you take on a run is a combination of stride length which involves ground contact time, air time, vertical displacement among other things. All these variables interact. Changing one will affect others.
Elite runners run how they feel comfortable. Sometimes it is a high cadence, sometimes it is a low one. Some like Mo Farah have a long stride with low cadence, others like Tirunesh Dibaba are getting their feet to contact the ground as often as possible.
If you enjoyed these articles why not take a look at the ones I wrote about Stride Length – part 1 and part 2.
In the Introduction I detailed how, in his Running Formula book, Jack Daniels states that his survey of runners at the 1984 LA Olympics found everyone in events over 3000m had a cadence of 180 or greater – with one exception.
In this post, I’m looking at the 10000m and marathon races from the 2017 World Championships and finding more anomalies than Jack discovered. To read about the cadences of Sprinters and Middle-Distance runners – click the links.
Men’s 10,000m
The race was won by Great Britain’s Mo Farah in 26:49.51s with Uganda’s Joshua Cheptegui and Kenya’s Paul Tanui finishing less than a second behind him. Twenty-two runners had started the 25-lap race and while the early going was slow the race eventually settled down to running laps at around 4:15-30/mile pace. Gradually runners were dropped from the lead pack and at the bell Farah was leading a group of six; it was here that he kicked and covered the final lap in under 56 seconds.
The technical report on the race covers the first eight finishers and provides their data in the home straight on the 15th lap. We are given the Step Rate when the race has settled down and the runners are running at around 4:30/mile.
Step Rate (Hz)
Cadence (SPM)
Farah
2.89
173
Cheptegui
3.04
182
Tanui
3.07
184
Muchiri
3.44
206
Yimer
3.23
194
Kamworor
3.09
185
Hadis
3.07
184
Ahmed
2.85
171
Average
3.09
185
Table 1 – Step Rate (Hz) and Cadence (SPM) data for top 8 finishers in Men’s 10,000m
I’ve done the conversion from Step Rate to cadence and we can see there is a huge range from 171 up to 206spm. Mo Farah is just a couple of steps higher at 173 than Canada’s Mohammed Ahmed (171). It’s clear a sub-180 cadence was no hindrance to Farah because he won the gold and Ahmed finished 8th in 27min02 only fifteen seconds behind.
Many of the athletes are running at Jack Daniels’ predicted 180 cadence with Kenya’s Jemal Yimer (194) and Ethiopia’s Bedan Muchiri (206) being the notable exceptions. While the focus of these posts has been to ignore stride length; I think it is useful to recognise Muchiri’s is 1.75m here.
The technical report also provides greater detail (table 2) for the three medallists with their cadence from five points in the race including the home straight as they battle for gold at top speed.
Lap 5
Lap 10
Lap 15
Lap 20
Lap 25
Lap 5
Lap 10
Lap 15
Lap 20
Lap 25
Farah
2.93
3.09
2.89
2.97
3.33
176
185
173
178
200
Cheptegui
3.01
3.04
3.04
3.05
3.45
181
182
182
183
207
Tanui
3.10
3.15
3.07
3.12
3.45
186
189
184
187
207
Table 2 – Step Rate (Hz) and Cadence (SPM) data for Men’s 10,000m medallists
What we see is that, for much of the race, Mo Farah is operating at sub-180 cadence while Cheptegui and Tanui are operating at 180-190. It’s when they reach the final lap of the race that they put the afterburners on and here we see all three runners increase their cadence. Mo Farah continues to have the lowest of the three albeit he is achieving a cadence of 200 at this point.
Women’s 10,000m
The women’s race was run differently to the men’s 10000m. While initially both races began slowly with a pack of runners bunched together; it was about twelve minutes into the women’s race on the 9th lap that eventual winner Almaz Ayana took charge.
While the 8th lap had been completed in 1:15 (5min/mile) she now moved to the front and upped the pace with the next two laps coming in 1:08 and 1:07 (4:35-40/mile). Gradually she pulled away from the the rest of the field, lapping back markers and went on to win gold finishing almost a minute ahead of the other medallists. There was a tussle between Tirunesh Dibaba (silver) and Agnes Tirop (bronze) over the last lap with Alice Nanowuna following in fifty metres behind them.
The cadence data (table 3) is a little more conventional for the women with all the runners between 180-192 yet there is one exception – Kenya’s Alice Nawowuna who is down at 173. The race commentators mention Nawowuna is the tallest of the three Kenyans which could explain a longer stride.
Step Rate (Hz)
Cadence (SPM)
Ayana
3.14
188
Dibaba
3.17
190
Tirop
3.20
192
Nawowuna
2.88
173
Krumins
3.07
184
Infeld
3.02
181
Cheptai
3.07
184
Huddle
3.17
190
Average
3.09
185
Table 3 – Step Rate (Hz) and Cadence (SPM) data for top 8 finishers in Women’s 10,000m
As with the men’s data, the sample is from midrace approaching 6000m where they are running at about 4:50-55/mile with the exception of leader Ayana who is at 4:35 and Molly Huddle at 5:03.
Below in table 4 we see the race breakdown for the medallists and cadence increases in the final lap on the home straight. Ayana is unchallenged so never has to hit her highest gear. The battle between Dibaba and Tirop is close and we can see their cadences are very different. At this stage of her career, Dibaba had been running marathons for three years and it is notable how smooth her stride is sprinting against Tirop. At 228, Dibaba’s turnover in this finishing straight is as good as, or better, than many middle distance runners while throughout the rest of the race she is above average by hitting the low 190s.
Lap 5
Lap 10
Lap 15
Lap 20
Lap 25
Lap 5
Lap 10
Lap 15
Lap 20
Lap 25
Ayana
3.06
3.03
3.14
3.03
3.23
184
182
188
182
194
Dibaba
3.09
3.19
3.17
3.23
3.80
185
191
190
194
228
Tirop
3.08
3.09
3.20
3.03
3.26
185
185
192
182
196
Table 4 – Step Rate (Hz) and Cadence (SPM) data for Women’s 10,000m medallists
Marathon
The 2017 World Championship marathons were held on a four lap street circuit around London with each lap measuring about 10km. While there were some long straights on the course, it also had a number of corners to be negotiated which either required runners to run wider or adapt their pace. It was a true head-to-head race in the sense of trying to beat other runners rather than going for a time.
The marathon data is possibly the most interesting data in this whole study because we have two sets of data for the men recorded at around 30km and 40km and, with runners tiring in both men’s and women’s races, we get a glimpse of them running at paces we might expect from above average recreational runners.
The men’s race was won by Geoffrey Kirui of Ethiopia in 2:08:27. Table 5 shows his cadence on lap 3 is 191spm where he is recorded running at 4:50/mile. Having taken the lead at 35km and opened up a lead over silver medallist Tamirat Tola, he had slowed by the 40km mark. By this point he was running at 5:25/mile and his cadence had dropped to 186spm.
Lap3
Lap4
Step Rate (Hz)
Cadence (SPM)
Pace (per mile)
Step Rate (Hz)
Cadence (SPM)
Pace (per mile)
Kirui
3.19
191
4:50
3.10
186
5:25
Tola
3.05
183
4:58
3.00
180
5:51
Simbu
2.91
175
5:22
2.89
173
5:27
Hawkins
3.12
187
5:21
3.23
194
5:11
Kipketer
2.85
171
5:29
2.86
171
5:42
Meucci
3.14
186
5:29
—
—
—
Ghebregergis
2.96
178
5:37
2.99
179
5:49
Wanjiru
3.20
192
5:26
3.08
185
6:10
Average
3.05
183
5:19
3.02
181
5:39
Table 5 – Men’s marathon data at roughly 30 and 40km
Of the other six runners who data was recorded for, only Callum Hawkins increased his pace in the last 10km – this was consistent with him moving up in the race from 8th place to finish 4th. To run 10secs/mile quicker his cadence increased from 187 to 194.
Meanwhile Tola, who slowed by almost a minute per mile, dropped his cadence from 183 to 180; similarly Wanjiru who slowed to over 6mins/mile had his cadence drop from 192 to 185. The other three runners see a small drop in pace – Simbu slows by 5secs/mile – a relatively low cadence of 175 drops further to 173; Kipketer’s cadence remains the same as he slows by 13secs/mile and the one anomaly is Ghebregergis who fractionally increases Step Rate while slowing by 12secs/mile. I’d be inclined to see this as remaining the same with the 0.01Hz change attributable to the normal variations which occur while running.
The women’s marathon was won by Rose Chelimo in 2:27:11 – not a particularly fast time by modern standards – equating to an average pace of 5:37/mile (35min per 10K). But it was closely contested with the top four runners finishing within ten seconds of each other.
Unlike the men’s race, there is only data provided from the 4th lap – the 40km mark – and at this late stage of the race we see in table 6 a variety of paces from the 5:28/mile of USA’s Amy Cragg who is almost a minute per mile quicker than Kirwa and Dibaba at 6:17 (barely quicker then a 20min 5K parkrun).
Lap4
Step Rate (Hz)
Cadence (SPM)
Pace (per mile)
Chelimo
3.31
199
5:41
Kiplagat
3.07
184
5:41
Cragg
3.29
197
5:28
Daniel
3.09
185
5:37
Demise
2.95
177
5:56
Kirwa
3.10
186
6:17
Kiprop
2.75
165
5:58
Dibaba
2.92
175
6:17
Average
3.06
184
5:51
Table 6 – Women’s marathon data at roughly 40km
We see a significant range of cadences despite all eight finishers running 2hr27-28. Gold and bronze medallists, Chelimo and Cragg are hitting the 190s with Kiplagat, Daniel and Kirwa in the mid-180s – all in line with Jack Daniels’ findings.
Yet there are three runners with sub-180 cadences. There are Ethiopia’s Shure Demise and Mare Dibaba (unrelated to Tirunesh) in the mid-170s. And then there is Kenya’s Helah Kiprop running at only 165spm. Finishing seventh, a minute behind Chelimo this was far from her best race which was a Marathon Majors win in Tokyo in a time of 2:21:27. Knowing she can run a marathon around 20secs per mile faster opens up the question of whether she would achieve that pace through a quicker cadence, longer stride rate or a combination of the two. I would expect her to be capable of a quicker cadence as 165 is extremely low compared to all the other runners detailed.
Collating the data into table 7 for all 32 runners across the four races we see a symmetrical range of cadences where the majority are in the 180s – which aligns with the average cadence data being 183-185spm. But it also highlights that over a quarter of these runners can be running at sub-180 cadences.
< 170
170s
180s
190s
200+
Cadence (SPM)
1
8
14
8
1
Table 7 – number of runners for each cadence grouping
While the variety of paces goes from 4:15/mile in the men’s 10,000m down to 6:15+/mile in the women’s marathon – we should remember these are all world class athletes who are training many hours per week and getting excellent coaching. They are running times many of us will only dream of and among these runners having a sub-180 cadence is not holding them back.
We’ve also glimpsed cadence at slower paces – the marathons have three men running at 5:49, 5:51, 6:10 per mile and four women running at 5:56, 5:58, 6:17, 6:17 – these are the paces for a 18-20min 5K. The cadences for these seven runners are 179, 180, 185 and 177, 165, 175, 186.
This suggests, but is by no means definite that, as elite runners move towards recreational paces their cadence can be lower than 180. It’s also backed up by how when the men slowed in their race, four of six runners had lower cadences, while Callum Hawkins increased his pace by increasing his cadence as did each of the 10000m medallists.
In the final post in this series I will summarise what the cadence data can tell us about running and what it might mean for you as a recreational runner. Click here to go to it.
Having looked at sprinters, our attention now turns to the middle distance runners. Traditionally competing in the 800, 1500 and perhaps the 3,000m; the research hit a problem – World Athletics didn’t report on any of these races at the 2017 World Championships. Fortunately, as I was writing this series of posts, the 2024 European Championships in Rome were taking place and so, I had to be like Jack Daniels, and do my own bit of counting. Using the televised footage I was able to replay certain sequences of the races to get an idea of the cadences involved.
I watched each race through in its entirety to get an understanding of how it played out and identify which runners were near the front of the pack and of whom I could get an unobstructed view. Often the TV director regularly switched between close-ups and long shots of the race, on different runners and by necessity switching to different cameras positioned around the track. Typically I managed to count the paces for 15-20secs and then multiplied that up to get a value per minute. Being manually calculated in this way, I could be out by a few steps per minute but we’re interested in getting a rough idea of the numbers involved – not doing an exact scientific breakdown!
Having identified one runner for each race I then did a lap-by-lap breakdown for them. This was necessary because longer races can start off slowly, building the pace and then finishing in a mad dash to the line. We might expect different cadences as the race pace picks up or lulls. With only one runner analysed per race it’s by no means a perfect look at the cadences we see but it’s an indication.
800m
The men’s final was won by France’s Gabriel Tual in 1:44.87 and it was his data I collected for the two lap race. The first lap took 53sec which is around 3:30/mile and his cadence was 197spm.
The 2nd lap was marginally quicker at 52sec but in the home straight Tual put in a big sprint finish and this was what I measured. I watched and rewatched the video multiple times as my first calculation had him registering a cadence of 234spm, a second viewing it was 224 and I finally settled at 228spm. This is a significantly higher value than the rest of his race but what we expect when runners sprint.
For the women’s 800m, I used Great Britain’s Keely Hodgkinson as my subject. She’s run the fastest time in the world this year and is in with a chance of winning gold at the Paris Olympics. She actually won the gold at these championships, but I recorded her cadence in the semi-final where she ran 1:58.08.
The first lap of the race was run in 57.6s followed by a slightly slower second lap of 60.4sec. The cadence for the first lap was 202spm, rising to 206spm on the second. This might seem strange given the second lap was slower but from 400-600m the runners slowed before Keely accelerated away on the final bend where I measured her second lap cadence.
What we can see from both the men’s and women’s race is it’s not unusual for 800m runners to have cadences of over 200 during the main race. And with speed being a key requisite for its runners, it’s no surprise to see that a runner like Tual has the ability to hit even higher cadences.
1,500m
Norway’s Jakob Ingebrigtsen is arguably the star of male middle distance track racing at the moment. It was his data (table 1) I captured during the heats of the men’s 1,500m event. Due to the race being a 300m lap followed by three full 400m circuits, it is difficult to know where to place the short ‘lap’ when trying to ascertain split times.
Cadence (Spm)
Pace (per mile)
Lap 1
189
3:57
Lap 2
186
4:09
Lap 3
193
3:49
Lap 4
208
3:37
Table 1 – data for three medallists nearing the finish line
Being a heat, it was an easy race for Jakob and he seemingly jogged off the start line such that everyone was ten metres ahead of him. From there he sat at the back of the pack avoiding trouble until the final 300m when he overtook everyone and finished first. We can see his cadence is steady around the 186-194 mark while he was at the back and then when he accelerated it went over 200.
The women’s final where I obtained the cadence data was run even more tactically with the first two laps at a relatively sedate pace before it began to wind up and Ireland’s Ciara Mageean came through to take the gold. Even though the pace was a little slower we see that the cadences were all lower throughout.
Cadence (SPM)
Pace (per mile)
Lap 1
184
4:30
Lap 2
185
4:34
Lap 3
180
4:13
Lap 4
204
4:01
Table 2 – Ciara Mageean’s cadence at 1,500m
So that’s cadence for middle distance runners. Bear in mind, the data provided here is limited to four individuals – Gabriel Tual, Keely Hodgkinson, Jakob Ingebritsen and Ciara Mageean. There’s strong reason to believe its representative for all elite runners but there will be some individual variance with others.
If this data shows us anything in particular it’s that the faster you run – the higher your cadence. Intuitively that makes sense. We see the “magic 180” figure is being adhered to at paces around 4:30/mile and when middle distance runners break into a sprint they go over 200spm but never approach the cadence of the short sprints.
In the next post – we will look at the cadence of long distance runners. Most recreational runners only compete in these types of races so it should provide interesting data. Click here to go to it.
In the introduction to this series I wrote about how running coach Jack Daniels spent the 1984 LA Olympics measuring the cadence of runners, but what he didn’t measure was the cadence of elite sprinters. This may simply have been because, as a distance running coach, he wasn’t interested by sprinters; or it may be because sprinters are significantly quicker making counting harder.
Fortunately World Athletics produced a series of reports from the 2017 World Championships giving us the data for sprinters as well as distance runners. Through the use of digital technology the research is very accurate. Using cameras capable of capturing up to 250 frames per second, runners were recorded in the middle of the home straight and then again in the 10 metres before the finish line.
At this point, we need to recognise that sprinters don’t work in cadence (number of steps in a minute) probably because their races are over in seconds. They refer to frequency or Step Rate (Hz) – how many steps they take per second! Still to try and make it meaningful for this article, I’ve calculated the equivalent cadence – multiplying by sixty and rounding off – to get a value for a minute.
100m
Table 1 below shows the step rate and calculated cadence for the men’s 100m with competitors ordered by their finish place. Justin Gatlin took gold in 9.92secs, Christian Coleman silver in 9.94s and Usain Bolt took bronze in 9.95s – just 0.03seconds separating them.
The cadences were sampled during the mid-section of the race when athletes are accelerating and their cadences will still be high. We can see, with the exception of Bolt, that the cadences range from 278 (Prescod) to 300 (Simbine and Su). These are typical elite men’s values. Usain Bolt’s turnover is notably lower at 263 which is probably because he is tall (6’5” / 1.95m) and that makes it harder to recover the legs quickly. This obviously didn’t stop him having a successful career as his height gives him a longer stride.
Step Rate (Hz)
Cadence (SPM)
Gatlin
4.67
280
Coleman
4.95
297
Bolt
4.39
263
Blake
4.85
291
Simbine
5.00
300
Vicaut
4.90
294
Prescod
4.63
278
Su
5.00
300
Table 1 – Men’s 100m final data at around halfway
In any sprint the cadence is highest at the beginning where athletes take small, quick steps to accelerate. As the race goes on they begin to rely on stride length (which is why Bolt excels in the later stages of both the 100m and 200m) and the cadence drops partly due to spending longer in the air – ‘longer’ is measured in hundredths of a second though.
Table 2 details only the medallists in the final 10metres of the race we can see the Step Rate / Cadence has dropped albeit it is still notably high. In such a tight race we can be sure all three sprinters are giving their best effort and therefore these values are representative. There’s roughly a 10% drop-off from earlier in the race.
Step Rate (Hz)
Cadence (SPM)
Gatlin
4.24
254
Coleman
4.55
273
Bolt
3.97
238
Table 2 – data for three medallists nearing the finish line
These sprint values are matched by women sprinters as you will see in table 3 below. Perhaps their values are a little lower overall but we can see from Baptiste and Ahouré that women are capable of the highest cadences. Just as the men use no one set cadence (or step frequency) throughout – it changes and adapts as the race goes on – the three female medallists do too.
Likewise, as Bolt showed how height affects cadence, we see Schippers at 5.9” (1.79m) has a slightly lower cadence than the others in the field at 275. Approaching the line there is a slight increase in her cadence, which is probably a negligible difference, and which probably reflects two World Championship golds won in the 200m and would have involved training speed endurance for a longer race.
Step Rate (Hz)
Cadence (SPM)
Bowie
4.72 dropping to 3.97
283 dropping to 238
Talou
4.76 dropping to 4.46
286 dropping to 268
Schippers
4.59 increasing to 4.63
275 increasing to 278
Ahouré
4.95
297
Thompson
4.67
280
Ahye
4.85
291
Santos
4.81
289
Baptiste
5.00
300
Table 3 – Women’s 100m final at halfway plus medallists nearing the finish
400m
In running one lap of the track as fast as possible, a world class 400m runner completes the distance in around 45 seconds if they’re male, 50s if they’re female. It is an event where anaerobic energy plays a large part in creating the speed but where the build-up of ‘lactic acid’ causes the legs to start seizing up – particularly in the home straight. (It’s not really lactic acid but that’s the conventional wisdom).
The data presented in table 4 from the men’s 2017 World Championship final is taken at 350m – so the legs will be starting to struggle. Again runners are listed in their finishing order.
Step Rate (Hz)
Cadence (SPM)
Van Niekerk
3.33
200
Gardiner
3.37
202
Haroun
3.66
220
Thebe
3.75
225
Allen
3.41
205
Gaye
3.85
241
Kerley
3.66
220
Table 4 – Men’s 400m cadences in the home straight
And here in table 5 is the data for the women’s race.
Step Rate (Hz)
Cadence (SPM)
Francis
3.37
202
Naser
3.62
217
Felix
3.33
200
Miller-Uibo
3.29
197
Jackson
3.80
228
McPherson
3.44
206
Mupopo
3.58
215
Williams-Mills
3.75
225
Table 5 – Women’s 400m cadences in the home straight
With these values occurring in the home straight where the commentators say “the bear jumps on your back” due to the lactic build-up making the limbs feel heavy; we aren’t necessarily getting the entire picture of the cadences which 400m runners are capable of achieving.
Fortunately there is data available here detailing the cadences in the four quarters of the 2016 Rio Olympic final where Wayde van Niekerk set the world record running against two of his main rivals Kirani James and LaShawn Merrit; as well as the data from Michael Johnson’s previous world record run in 1999. While it appears these are manually counted by the blogger, the numbers are very close to those presented in the 2017 WC report for van Niekerk; a report which also contains data for Butch Reynolds who set the previous world record. This is all detailed in table 6.
0-100m
100-200m
200m-300m
300m-400m
0-100m
100-200m
200m-300m
300m-400m
Van Niekerk (43.03WR)
3.98
3.90
3.81
3.50
239
234
229
210
Johnson (43.18WR)
4.31
4.08
4.21
4.11
259
245
253
247
Reynolds (43.29WR)
3.65
3.74
3.74
3.64
219
224
224
218
James (43.76)
3.89
3.86
3.78
3.42
233
232
227
205
Merritt (43.85)
4.19
4.17
3.93
3.49
251
250
236
209
Table 6 – comparison of elite 400m runners Step Rate and Cadence across whole race
What’s notable is the variance across the runners. You go from Butch Reynolds who is consistently around 220 for the whole race up to Michael Johnson who is consistently around 250. In between the other runners all start off with a high cadence which is dropping off by the final 100m.
What we can say for sure is the longer sprint distance of 400m results in lower cadences than those in the 100m. Johnson has the highest cadence of anyone here at 259 in the first 100m and that’s below the 100m runners who, with the exception of Bolt, were in the 280-300 range.
This isn’t surprising as 400m runners tend to be taller than 100m runners, usually over 6’ / 1.85m taking long strides to cover the ground quickly which combines with a lower cadence. It’s not always the case – Michael Johnson has the highest cadence yet is slightly taller than van Niekerk. They may also have lower cadences or shorter strides because they are running slower – the male 400m runners are averaging just under 11 seconds per 100m.
I’ve deliberately not included stride lengths in this piece because it’s here to give an idea of cadences across events. But what Johnson and Reynolds show is how there is no one specific cadence or stride length being used to get them to a world record – each adopted what worked for them.
In the next article, it’s time to look at the middle distance runners – click here to go to it.
Is taking 180 steps per minute the magic number to aim for? Just about every search you do on the web will tell you it is. I’m not entirely sure though. As you will see almost all elites do indeed run with a cadence of 180+. But they’re elites and they’re typically only measured running at elite paces i.e. 5min / mile or better.
If you’ve arrived here by Google (or any other search engine of your choice) then you probably already know what cadence is. If you didn’t – it relates to how many steps you’re taking per minute – your step rate, sometimes inaccurately referred to as stride rate. The two tend to be used interchangeably. Maybe that’s why it’s easier to refer to it as running cadence!
Your running cadence is likely to be somewhere between 160-200; although at one stage mine was as low as 150. It’s also possible for it to be a little higher than 200. If you’re walking it will be significantly lower – something like 100-120. All of it, as we shall see, depends on how fast you’re moving.
In the days when information was less accessible and sport science was still evolving; I recall reading that running speed is simply the result of how many steps you take in a minute and how far you travel with each step. This was made to sound mathematical by saying Running Speed = Step Frequency x Step Length. If you take 200 steps in a minute and cover 1 metre with each then you run 200m in a minute therefore with 1,609 metres in a mile you’re running at 8min/mile.
I previously tackled Stride Length in a couple of articles written some time ago because I feel that’s more important for recreational runners to work on. But having written articles on how the glutes should power runners and how it’s possible to create high cadence by not using the glutes I wanted to dig further into the topic.
Origins of 180
In his Running Formula book, renowned coach Jack Daniels states that he and his wife spent the LA Olympics in 1984 counting the cadence of elite athletes. Rather than count the steps, they counted armswings because they’re always in sync – as a leg moves forward, an arm moves forward. It’s a good way of counting cadence which I use when I’m evaluating runners.
Jack found that 800m runners had the highest cadences of over 200 with other middle distance runners approaching this value. Once he turned to the runners in races longer than 3000m he found the cadence was lower; yet all but one runner had a cadence of 180 or more.
While I cannot state for certain this is where the magic 180 number came from, I think it’s quite likely. During those Olympics he counted 50 runners – male and female and therefore got a good sampling. These days we are lucky enough to have cadence monitoring built in to our GPS or smartwatches and if we want to look at elite runners we can watch playbacks on digital film or video.
In this series of posts, I’m going to provide you with the cadence data for contemporary runners. Some of it has been calculated with the latest digital cameras and film; others I’ve used Jack’s method of counting armswings! I’ll be looking at sprinters and middle distance runners as well as those doing the longer events like 10,000m and marathon that many recreational runners race too.
To read part 2 and find out the cadence of elite sprinters – click here.
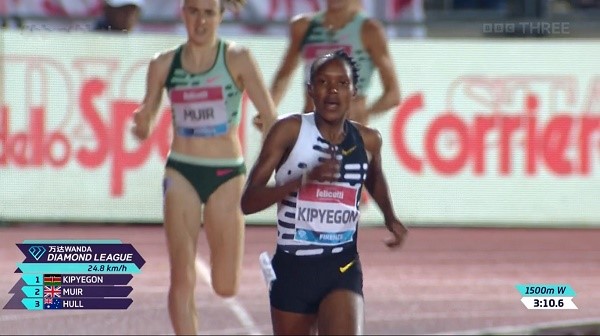
Elite women run fast. We know the sprinters are very fast running under 11seconds for a 100m. On Friday June 2nd at the third Diamond League meeting of 2023, Faith Kipyegon showed she has great speed reaching 25km/hr at times. It was that speed, combined with endurance, which enabled her to become the first woman to run 1,500m in under 3:50 – a pace which would have brought her in for 4:06 for a mile.
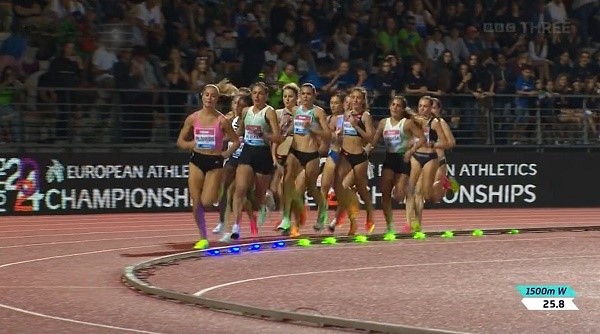
As the reigning Olympic and World Champion, Kenya’s Kipyegon who is approaching thirty years old was heavily favoured to win in Florence, Italy. While pacemakers are still present to lead runners out in the early laps, modern athletics now has a moving set of lights around the edge of the track to help with even pacing. These had been set at 62secs per 400m which equates to a 3:52.5 time.
The blue and yellow lights indicate the required pace
I took a look at the race to see how it was run and find out how the laps broke down. Due to its distance the 1,500 metres is unusual in starting at the beginning of the back straight – which allows athletes to cover 300m followed by three laps of 400m.
The splits as best I could determine them were:
100m – 14.5secs – imagine that. How many of us can even run that from a standing start without blocks even without having to run a further 1,400m?
300m – 46s – first crossing of the finish line
400m – 1:02.37s – first lap of the track
700m – 1:48.2s – second crossing of the finish line. Just before this around the 600m mark the first pacemaker dropped out
800m – 2:04 – second lap of the track taking 61.63s. The other pacemaker drops out at 900m
1100m – 2:50 – third crossing of the finish line – one full lap to go
1200m – 3:05.28 – third lap of the track taking 61.28s. The last 100m has only taken 15-16s
1500m – 3:49.11 – a new WORLD RECORD. The final lap has taken 58.81s – a pace of 3:57/mile
It’s a truly remarkable performance which saw Britain’s Laura Muir finishing eight seconds behind in a season’s best time of 3:57.09 and Australia’s Jess Hull setting a national record in 3:57.29 as she finished third. Both runners had worked their hardest to keep up with Faith Kipyegon yet they ended up thirty metres behind. No-one in the rest of the field could even crack four minutes which begins to give an indication of the gulf that exists between Kipyegon and the others.
Faith Kipyegon flies down the back straight on her way to a new world record
Watching her run, she has decent compact form and is very balanced. Every stride is powerful and I’d estimate she’s taking around 200 steps per minute. This isn’t unusual for a middle distance runner or for a shorter runner. Faith is listed at 1.57m / 5’2” and weighs 43kg / 93lbs. What’s surprising is when you calculate the distance she’s covering with each step it works out at around 2.08m and that’s over 30% longer than she is tall. And she’s doing it for almost four minutes!
As a coach, these are the things I think about and marvel at. I’ve previously written two articles on stride length (first and second) as well as what elite runners speed is. Developing these can take time but is worthwhile even for distance runners. Consider that on average Faith Kipyegon’s new world record is the equivalent of running fifteen consecutive 100m races in 15.2secs and there are no excuses available about having little legs!
The World Athletics championship opened on Friday 15 July 2022 in Oregon, USA. As I’m based in the UK, I’m not going to see much of it live as, while some events start in the evening in my time-zone, the majority take place after midnight.
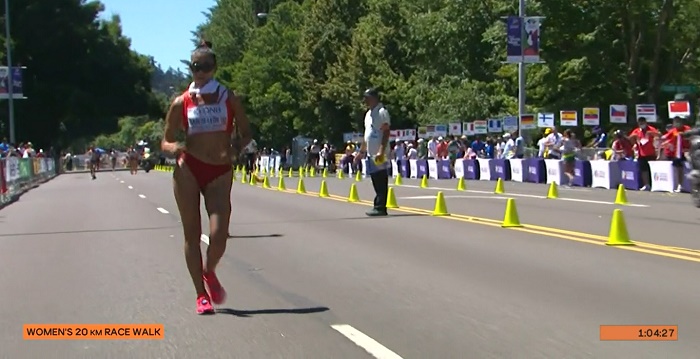
What I caught on Day 1 began with the field events of hammer and high jump along with a couple of track events, the Mixed 4x400M relay and preliminary heats of the Men’s 100M. But the real highlight was away from the stadium where we were treated to the Women’s 20KM walk!
Race walking is a sport which is somewhat derided and I am being slightly sarcastic when I say it’s a highlight. Yet, I have a fascination with all things sporty and what I can learn from them and I’ve actually watched race walking at some of the past Olympics. Given it’s similarity to running it’s interesting to dig into the details and analyse.
Race walking at the elite level is surprisingly fast and there are two event distances – 20 and 50km. A little bit shorter than half marathon (21.1km) and longer than a marathon (42.2km). It’s only in the past decade the women have been allowed to compete in the longer walking distance.
There are two basic rules that differentiate it from running.
You must always have one foot in contact with the ground as judged by the naked eye. This “naked eye” caveat was instituted in recent years because with the advent of high definition television pictures, it became clear everyone was lifting off and travelling through the air!
When the front foot lands the leg must stay straight until the body passes over it. The knee cannot bend.
Breaking either of these rules results in a warning red card and if three are received, the walker has to take a penalty stop of 1-minute per 10K of race distance. If they break the rules a fourth time they are disqualified. However, there’s a twist as in the last 100 metres, a walker may be disqualified even if they haven’t had any previous cards which avoids them gaming the system and breaking into a sprint at the line! The drama of the race begins to occur as competitors accumulate penalties or risk everything to go that bit faster.
The commentators made the point that tactically there’s not much you can do in race-walking. Its limitations, as I shall explain, means there is an inherent top speed. It’s not like distance running where you might decide to conserve your energy by sitting behind an opponent and then sprinting for the line!
By always having one foot in contact with the ground, a walker’s stride length is limited by the length of their legs. As one foot leaves the ground, the other must already be touching it.
This begins to highlight a big difference with running where runners can push off with each step and travel through the air. They get a longer stride length by doing this – as much as 2.70m for world class male sprinters and almost 2m for distance runners. The average man walking along the street usually has a stride of around 90cm and when I measured my biggest possible step it was a highly uncomfortable, full stretch 1.35m.
In his book Mathletics, John D. Barrow a professor at Cambridge University analyses how race walkers achieve their speeds and concludes that to achieve the world record pace, it requires the walker to have a leg length of 2.3m. Basically they have to be leaving the ground to go as fast as they do! What the walkers are good at is eliminating any up and down motion. Their centre of gravity always remains level and all effort goes into propelling themselves horizontally forwards.
This means their cadence – the number of steps taken per minute – is a big factor in how fast they walk. The best in the race I watched were hitting a cadence of around 200 steps per minute but again this has limitations. Sprinters achieve very high cadences of around 250 steps per minute but they can only hold onto this for a minute. Middle distance runners tend to be over 200-220 steps and are closer to the race walkers in this respect.
But it’s a key difference between running and race-walking that middle distance runners achieve high cadence by ‘shortening the lever”. When their back foot leaves the ground it comes up to almost kick their backside. This shortening allows the rear leg to travel under the body quicker than if it were staying straight. This is basic mechanics that occurs with the pendulum of a clock speeding up or slowing down depending on its length and which you can easily test by swinging a weight on a piece of string.
What a tall walker gains in stride length, they lose in cadence because their long levers move slower.
The pronounced tilt of the hips and shoulders
Watching a racewalker, you immediately notice they all employ a distinctive wiggling method with the arms notably swinging. The hands stay low to keep the centre of gravity low and help avoid losing contact with the ground.
The reason for the wiggle is that it maximises the length of each stride. It involves rotation of the hips which is counterbalanced by the shoulders rotating. Unfortunately, if you go watch any amateur distance race you will seem many runners at the slower end of the field using a similar technique. This isn’t entirely a surprise as many amateur runners are going at paces slower than race walkers.
Together these factors begin to explain why many amateur runners aren’t achieving better times. Firstly they do too much ‘wiggling’ – their hips and shoulders rotate around the body. While this creates a longer stride, it often causes a heel strike which at best creates braking forces to slow them, but at worst may cause injury. Neither is desirable.
A secondary consequence of hip rotation is that it doesn’t cause the trail leg to swing up which would make their running more efficient. All they’re doing is penduluming their legs back and forth.
Now there are running methods which encourage runners to deliberately lift the trailing leg but I don’t advocate that, it should happen naturally with good mechanics. How far the trail leg swings up is dependent on how fast you’re running. But certainly if you’ve got excessive hip rotation going on, it will be harder to hit the top speeds that enable it to happen.
The most impressive part of race walking is the speed – they are not just ambling down to the shops to pick up a pint of milk. In Friday night’s, 20km walk the first kilometre was completed in 4:20 – the equivalent of a 21:40 parkrun! In Imperial terms it’s 6:58/mile and they went through five miles in under 35 minutes.
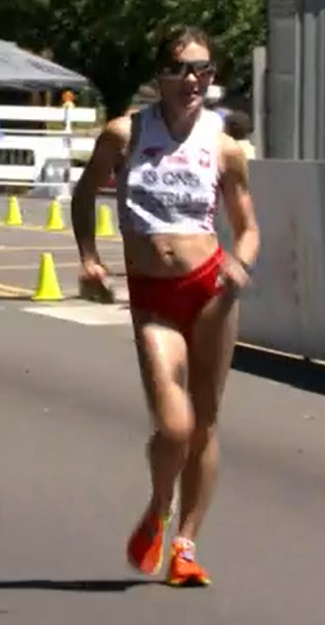
The Chinese women, Shijie Qieyang and Hong Liu started out quickly but were eventually caught and overtaken by Kimberly Garcia Leon and then Poland’s Katarzyna Zdzieblo. After 1:26:58 it was Garcia Leon who claimed the first gold medal of these World Championships and Peru’s first ever.
Later on the men’s race took place won by Japan’s Toshikazu Yamnishi in 1:19:07. I didn’t stay up to watch it!
Both of these times were within three minutes of the world records which are:
Women’s 20K – 1:23:39 – Elena Lashmanova (Russia) – June 9, 2018
Women’s 50K – 3:59:13 – Liu Hong (China) – March 9, 2019
Putting those numbers into a more familiar format we find the
Men’s 20K – a pace of 3:50/km or 6:10/mile – the equivalent of a 19:09 parkrun or 1:21 half marathon.
Women’s 20K – a pace of 4:11/km or 6:44/mile – equating to a 20:54 parkrun or 1:28 half.
Men’s 50K – a pace of 4:15/km or 6:51/mile – equating to a 21:15 parkrun or 2:59 marathon.
Women’s 50K – a pace of 4:47/km or 7:42/mile – equating to a 23:55 parkrun or 3:22 marathon.
Many amateur runners would be happy to achieve these sort of times. While race-walking is often spoken of in insulting terms, the efforts and results of the athletes are more than impressive.
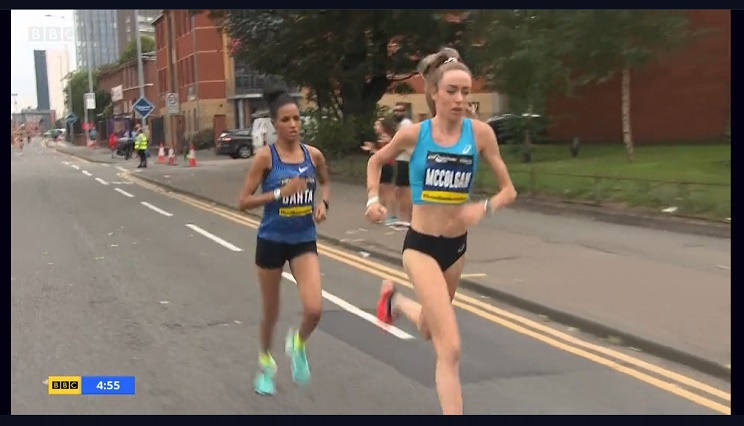
Scotland’s Eilish McColgan is the current golden girl of British Athletics. This year she has set distance records, the first occurred in February when she broke Paula Radcliffe’s British half marathon record by 21 seconds in 1:06:26. Then in May, she ran 30:19 to take Radcliffe’s 10K road record and on Monday (June 6th), she ran this time again on the track in Hengelo, Netherlands to set a Scottish record.
The McColgan name is not unfamiliar to followers of running. Her mother, Liz, was the World Champion in 1991 at the 10,000m having already been Commonwealth Games champion in 1986 and 1990 and silver medal winner at the 1988 Seoul Olympics. When she moved up to the marathon distance she won New York (1991), Tokyo (1992) and London (1996) marathons. Eilish’s father, Peter McColgan, was also a talented distance runner who competed for Northern Ireland in the 3,000m steeplechase and 5,000m at the Edinburgh Commonwealth games as well as for Great Britain in the steeplechase at the 1991 World Championships. What a pedigree for Eilish to have!
Not only does she have the genetic advantage but Eilish is also part of a generation of successful female Scottish distance runners. Laura Muir has been the most successful gaining a silver medal at last year’s Tokyo Olympics where she set a British record for the 1,500m in a time of 3:54.50 In 2012, Lynsey Sharp was European champion and competed at the London Olympics in the 800m. She followed this up four years later setting a Scottish record of 1:57.69 while finishing 6th in the Rio Olympic final.
A recent BBC article detailed that this year’s success is down to Eilish undertaking a reduced training load that Liz had to be persuaded would be in Eilish’s best interest. Liz had been running as much as 140 miles per week in her marathon prime.
But this highlights the event differences. Liz was always a long distance runner doing 10,000m and marathons. Following in her dad’s footsteps, Eilish competed in the 3,000m steeplechase for Great Britain at the London Olympics and then the 5,000m in Rio. It wasn’t until 2018 (when she 28 years old) that she began racing longer distances winning the ten mile Great South Run in 54:43. Roll on three years to the Tokyo Olympics and Eilish competed in both the 5,000 and 10,000m. Looking back at her Personal Bests, her time for 800m is 2:07.8 – over ten seconds slower than Lynsey Sharp and her mile is 4:00.97 which is five seconds slower than Muir. It’s clear that although Eilish competes in middle distance races, she lacks the top-end speed to be winner against the best and like her parents is better suited to the longer distances.
So it’s surprising when she talks in the article about how her training increased from 20, 30, 40, 50 miles per week and has only been operating at 65-70 over the last year and a half to two years. It’s not unusual for a world class 800m runner to operate on as little as forty miles per week but Eilish isn’t one. Typically world class 5,000 – 10,00m runners train between 70-100mpw. Given the recent increase in training mileage, it’s no surprise that when Eilish returned to the Great South run last October she was four minutes quicker than three years ago.
There’s no doubt decent mileage is critical to distance running success and Eilish’s approach of starting on low mileage and building up is a good one to follow but far too many runners simply aren’t doing enough mileage to support longterm improvement. Getting the balance right is important and, as Eilish shows, great results can be achieved off moderate mileage.
While I don’t wish to take anything away from how hard I’m sure she’s working in training, it should be noted many road and track records have been broken over the past couple of years due to the innovation of carbon plates in shoes. I am slightly sceptical Eilish would have been breaking Radcliffe’s records without them (at least in the near future); but many past records have been broken due to now-forgotten reasons outside of better athletic prowess. And in the longer term, unless the IAAF backtracks on the use of carbon plates, these records will become the new standard. All power to her – she’s still the best we’ve seen in a long time.
Whatever the reason, I have no doubt Eilish McColgan is going to go on to greater things as she gets the benefit of higher mileages and moves up to the longer distances permanently. At 31 years old, she has potential for another Olympic cycle in her and maybe more. I’m sure she will be looking to emulate her mother by taking on the London Marathon and other Majors.
Bonus content – Eilish is listed in Wikipedia at 1.80m (5’11). In my article on stride length I observed her cadence averaging 172 steps per minute giving her a stride length of 1.97m. It’s easy to think this is because she is tall and to an extent it is. But, as I also pointed out, Eliud Kipchoge (1.67m – 5’6”) has a stride length of almost two metres – about 15% greater than his height.
A quick look back at Paula Radcliffe running mile 5 of her record-setting 2003 London Marathon shows her running with a stride length of 1.67m (186-88 cadence) when she is 1.73m tall (5’8”). It’s a decent stride but it’s shorter than she is!
Kipchoge is famed for his excellent running form and economical stride and in Oct. 2019 he became the first man to run a marathon in under two hours. I found footage of the run on Youtube and watched a section from the last kilometre to calculate his stride length.
How to calculate stride length manually
You can skip past this section if you’d rather not get into the details
As we know Speed = Stride Length x Stride Frequency. We can rearrange that as Stride Length = Speed divided by Frequency. And because Speed is actually the distance covered in a time period (e.g. miles per hour); we can convert it to a Pace (e.g. 15mph is 4min/mile because 60mins / 15 = 4).
We need to find out how fast he’s running and how many steps he’s taking in a set period to be able to calculate the stride length.
Step 1 – Watching the footage I found a section where the camera showed Kipchoge for a decent length of time; the longer the better as it gives a more accurate sample. The particular segment lasted twenty seconds.
Step 2 – I counted the number of times his left arm swings. It doesn’t matter whether you count armswings or footsteps they’re going to match. Generally though I find armswings are easier to count. I counted thirty armswings.
Step 3 – As this was a twenty second clip, I had to triple it to get the cadence for a minute (3×30 = 90). But this was only for the swing of one arm so I doubled it (90 x 2 = 180) to get the total for both arms. Given arms and legs swing at the same rate, it gives the number of steps per minute – 180. Very conveniently it’s also three steps per second.
Step 4 – The marathon was run in 1:59:40 – an average pace of 4:34/mile. I remember Kipchoge was very consistent in his pacing so I’ve got a high level of confidence that his is how quick he was covering the ground.
Now I calculate how many steps Eliud covers in his 4:34 mile. In four minutes he covers 720 steps (180×4) and then in the remaining thirty-four seconds takes another 102 (34×3) for a grand total of 822 steps per mile.
Step 5 – As a mile is 1,609 metres and we know Kipchoge takes 822 steps to cover it, it works out that his stride length is 1.96metres (1609 / 822).
NB This final step has an implicit conversion from Imperial to Metric measuring systems. I could have gone metric earlier as I know he was running at 2:50/km, so he was taking 510 steps per km (1000/510 = 1.96) to get the same stride length.
Kipchoge’s Stride Length
If you skipped straight down here, let’s recap …. at his marathon pace of 4:34/mile, Eliud Kipchoge is taking 180 steps per minute with a stride length of 1.96 metres. What’s interesting, and defeats those people who say they have little legs, is that Kipchoge is only 1.67m tall (5’6”) – his stride is over 15% longer than he is tall.
I also found video of 18-year-old Eliud Kipchoge winning the 5000m gold at the 2003 World Championships in Paris. His running form looks a little less smooth than these days but he was still able to win in 12min52. I counted steps for one of his 400m laps close to the end of the race – he completed it in a touch under 1min05 – a pace of 4:21/mile. He took 202 steps and that works out to a stride length of 1.83 metres. Surprisingly it was shorter than he ran for a whole sub-2 marathon but may begin to explain why his form looked less smooth.
Nonetheless whichever race you look at Kipchoge’s stride length is bigger than he is tall and that’s worth thinking about.
If you found these posts about Stride Length interesting, you might want to take a look at the series I’ve written on Cadence or Stride Frequency as it’s also known. Click here to access the introduction.