I needed to get stronger if I was ever to run faster. This was my reason for signing up to the gym. At home I have some weighted vests, dumbbells and other equipment for the workouts I’ve been doing the past few years but I realised if I wanted to get stronger, I needed to lift heavier. That presented a choice – either buy more equipment which would take up space in my house and get used relatively infrequently or join the gym.
Ahead of returning to the gym I began to get excited thinking back to the times I’d lifted weights before. There were two primary periods – at the start of the 1990s when I was a teenager and in 2007-08 in my late thirties. I remember being able to bench press multiple reps at 90kg as a teenager and squat reps of 130kg in the Smith machine in my thirties. Now in my fifties would I still be able to achieve these standards?
While these might have been classed as goals, I wasn’t interested in setting specific goals. I had a vague goal – get stronger and stay healthy. Consequently the first few weeks in the gym were spent very carefully setting up for squats, deadlifts and bench press in the free weights area. Partly making sure I understood how to set up the equipment correctly but also prioritisiting technique over lifting heavy weights. I also didn’t want to get sore by trying to lift anything too heavy, too soon.
In the first session I found myself comfortably half-squatting 8 reps of 50kg and bench pressing 5x60kg. Four weeks later I was doing some half squats at 110kg and struggling to bench a couple of reps at 70kg.
My priorities have changed over the months as I identified weaknesses. For example, with the bench press, I attempted to press 80kg at Christmas and failed. I didn’t make the progress I was hoping to make considering I’d been able to do 65kg on my second session. So I moved to using the Chest Press machine to see if that would help. It didn’t and when I attempted 80kg again in my final session I got stuck and had my spotter give me a little bit of help to get it past the sticking point. Maybe next year.
Similarly I went to the gym intending to strengthen glutes and quads using squats and deadlifts. I stopped deadlifting at Christmas because I had a pulled a muscle in my back and need it to recover.
Injuries like that have been a part of this gym training but not while there. Both sides of my back (rhomboids) and both hamstrings have been strained but these injuries occurred while doing sprints. I believe it’s because I’ve strengthed the muscles and am now putting forces through other parts of the body which aren’t used to it. Injuries led me to add exercises to strengthen the adductors, abductors and hamstrings (leg curl) which can only be beneficial.
With squats my initial aim was to push the weight as high as possible over the training period. I reached 149kg just before Christmas in the Smith machine and added another 10kg just after but unracking the bar began to feel like it was squashing my torso even just standing with the weight on my shoulders. At the same time I realised my deep squats, where I could barely do a single effort at 70-80kg, were too low by comparison and since the New Year I focused on upping this. It’s been very successful as I managed to do a 100kg deep paused squat in my final week and felt there was capacity for another rep. I still occasionally worked the top end and managed to do multiple sets and reps of quarter-squats at 160kg in the free weights area.
On my final leg session I repeated my so-called Seb Squat Challenge which I did with half squats at Christmas and this time attempted it with deep squats. I completed it successfully but it might well have been the toughest session I’ve done. The ten reps at 85kg left me gulping for breath, just like when I’ve been sprinting!
Going to the gym twice per week has been enjoyable without feeling like I’m overdoing it. With my sessions on Mondays and Thursdays, it’s allowed me to go to parkrun on a Saturday with relatively fresh legs. While I didn’t have a benchmark run from before the weights I ran 23mins in my first month, the same again at Christmas, slipped to 25mins while injured and then have rebuilt it to 23mins with increased daily runs of 2-3 miles but no speedwork outside of very short sprints.
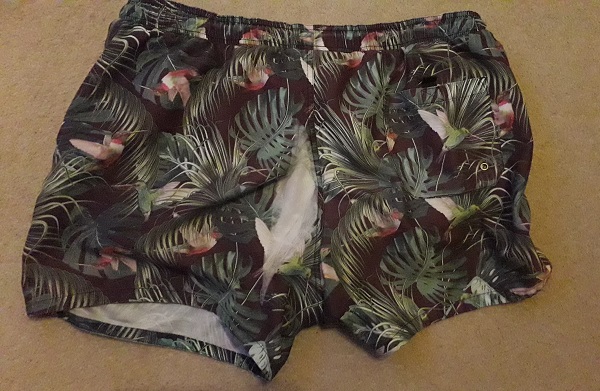
And this non-movement in parkrun time is while having putting on about 15lbs / 7kg / 1-stone in weight. My legs have grown by 2 inches / 5cm; as has my chest and arms – I look more like a rugby player than a runner. I detailed how my gym shorts ripped last month and when I put my tailored shorts on again a few weeks back they no longer fitted, they were far too tight. It’s been like that with most of my clothes.
It was never my aim to get bigger but I guess it’s inevitable as you add strength. I deliberately did low rep sets which are meant to avoid muscle hypertrophy. I particularly didn’t want to add upper body weight which doesn’t provide much, if any, benefit to running and maybe that’s why my bench press never improved back to my teenage days. But I was never in this to look good, it was always about functional training – providing muscle for power and health.
There is no doubt it has been an excellent investment of my time. As a general estimate I’ve added 20-30% strength in all the exercises I’ve been doing. I notice when I’m running I feel very stable around my core, my legs feel strong and that there is more to come.
While I could continue going to the gym over the summer, my aim is now to focus on turning the strength into power and rebuilding my lacate threshold to run faster over sprints and parkrun. I’m also interested to see how my body reshapes without any gym work, how much of the strength I’ve developed is retained and how quickly I can reaccess it next winter.